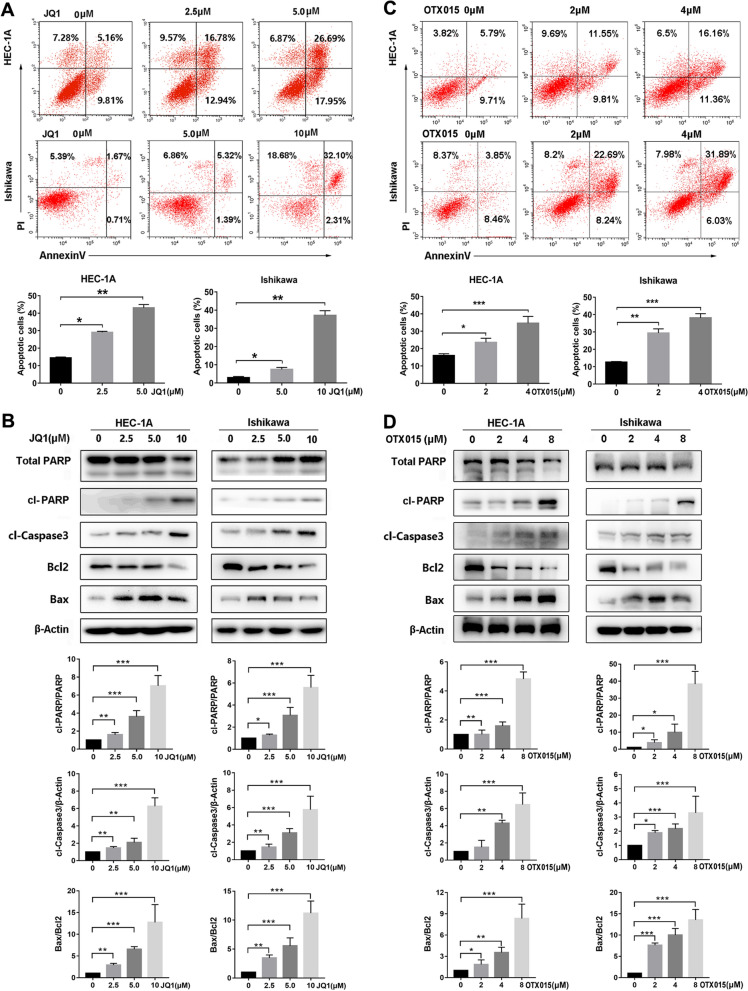
Fig. 4.
BET inhibitors induced apoptosis in EC cells. A HEC-1A and Ishikawa cells were treated with DMSO, 2.5 µM, 5 µM or 10μM JQ1 for 48 h. Cells were stained with Annexin V/FITC and PI, and then cell apoptosis was measured by flow cytometry. Data are shown in the histogram. Data shown are mean ± SD from three independent experiments. B HEC-1A and Ishikawa cells were treated with DMSO, 2.5 µM, 5 µM or 10μM JQ1 for 48 h. Protein expressions of total PARP, cleaved PARP, cleaved Caspase3, Bcl-2, Bax, and β-Actin were determined by western blot assay. β-Actin served as the loading control. The protein bands were quantified using ImageJ software and standardized by the β-Actin protein level. Data shown are mean ± SD from three independent experiments. C HEC-1A and Ishikawa cells were treated with indicated concentrations of OTX015 for 48 h. Cell apoptotic rates were measured by flow cytometry. D HEC-1A and Ishikawa cells were treated with indicated concentrations of OTX015 for 48 h. Protein expressions of total PARP, cleaved PARP, cleaved Caspase3, Bcl-2, Bax, and β-Actin were determined by western blot assay

