Figure 1.
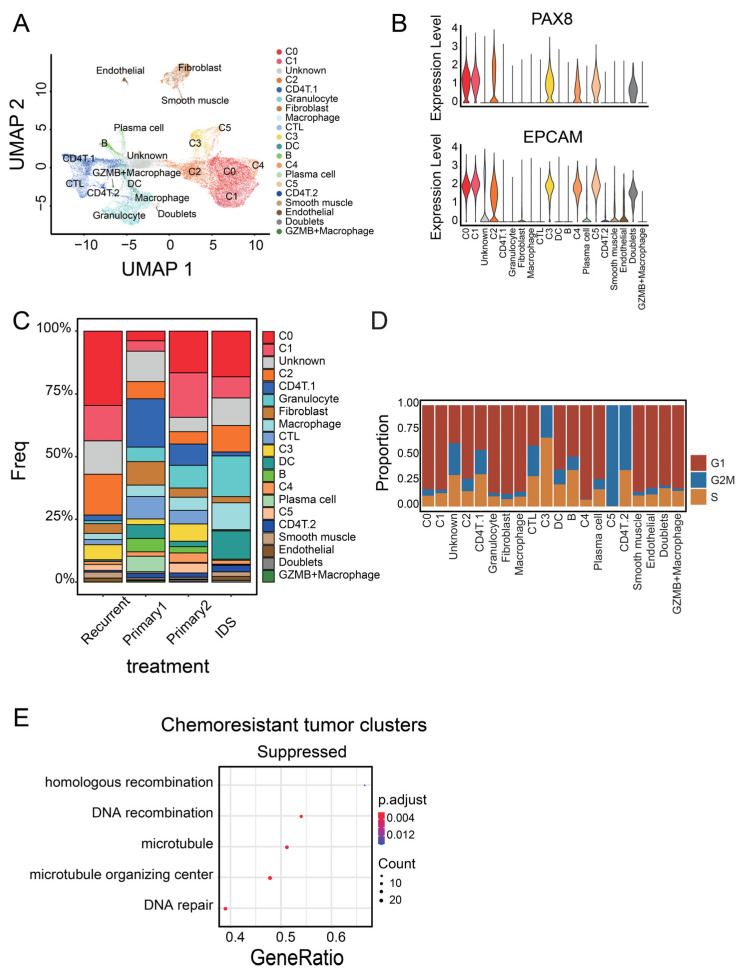
Identification of tumor cell populations associated with poor prognosis. (A) UMAP of 33,591 ovarian cancer cells from four patients, colored by cluster. (B) Violin plots of marker gene expression in ovarian epithelial tumor cells in Seurat clusters. (C) Stacked bar graph showing the cell proportion of Seurat clusters in four patients; 19 clusters were present in all four patients, while the GZMB+ macrophage cluster was present only in three patients. (D) Stacked bar graph of cell cycle in Seurat clusters. Each cell was classified into G1, S, or G2M based on the gene expression level. (E) GSEA dot plot for chemoresistant tumor clusters (C0, C1, C2, and C4). They were compared with chemosensitive tumor clusters (C3 and C5).

