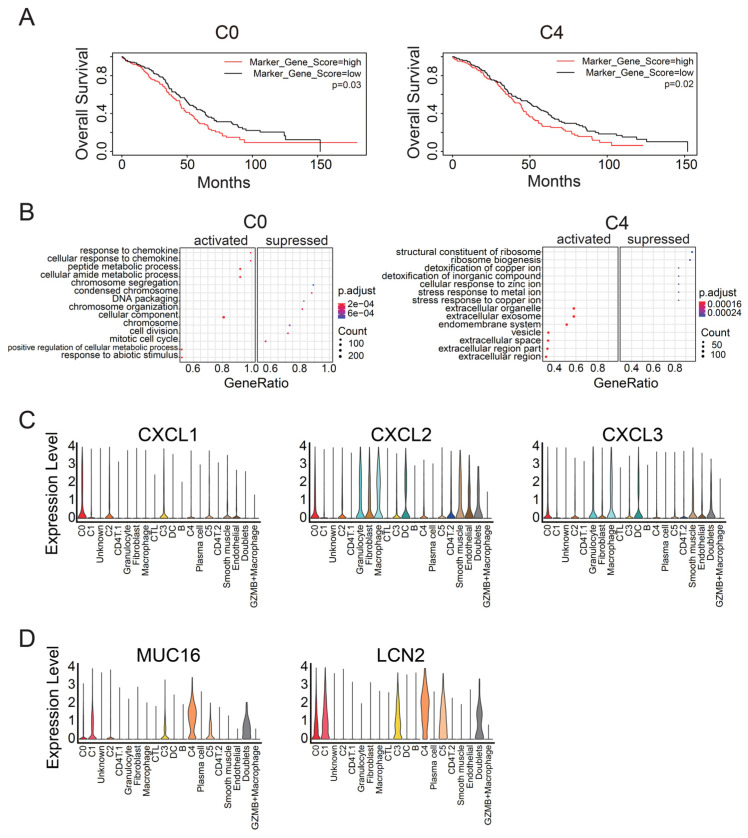
Figure 2.
GSEA of C0 and C4 clusters, the two malignant cell populations. (A) Kaplan–Meier plots for the C0 and C4 clusters, the two tumor clusters associated with poor prognosis, using TCGA survival data. The p-value was calculated using the log-rank test. (B) GSEA dot plots for the two malignant tumor clusters. Each tumor cluster was compared with the other tumor clusters. Each plot displays seven activated categories and seven suppressed categories. Dot color indicates adjusted p-value, and dot size indicates gene counts enriched to the Gene Ontology (GO) term. (C) Violin plots of chemokine expression in each Seurat cluster. (D) Violin plots showing the expression levels of the representative genes for the C4 cluster.

