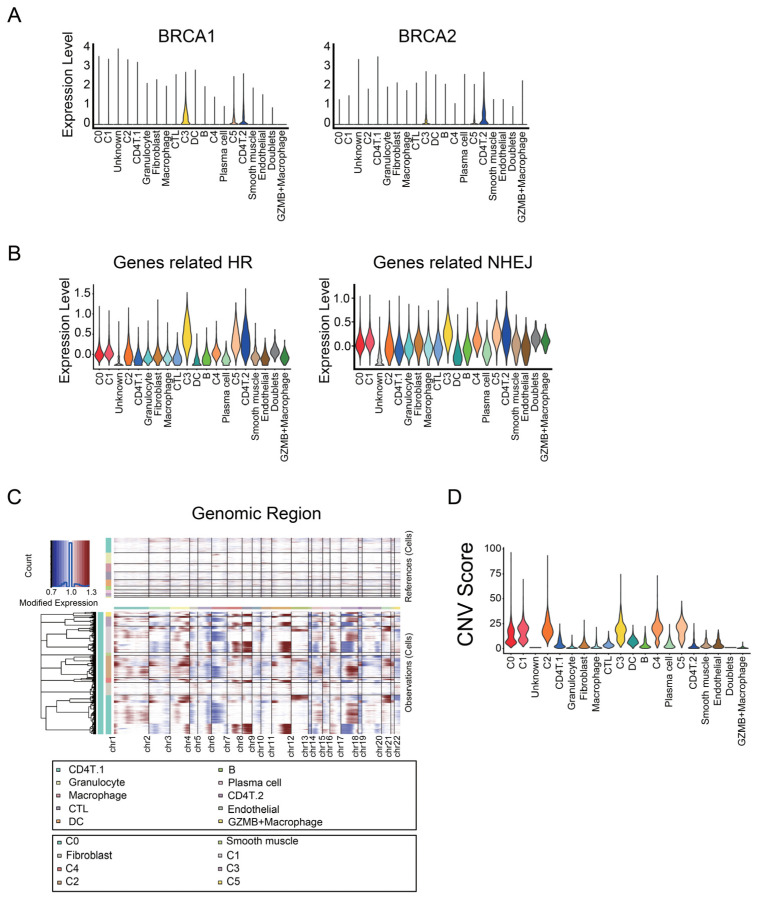
Figure 4.
Genome instability of malignant tumor populations. (A) Violin plots showing the expression level of BRCA1 and BRCA2 in Seurat clusters. (B) Violin plots showing the average expression levels of genes related to homologous recombination (HR) and non-homologous end-joining (NHEJ). (C) Heatmap of CNVs on chromosomes (cols) for individual cells (rows), estimated using the infercnv R package. Blood cells and endothelial cells were used as references for estimation. (D) Violin plot of the CNV score of the cells in Seurat clusters. The means of CNV scores in the two malignant tumor clusters were slightly lower than or almost the same as those in the other tumor clusters.

