Figure 6.
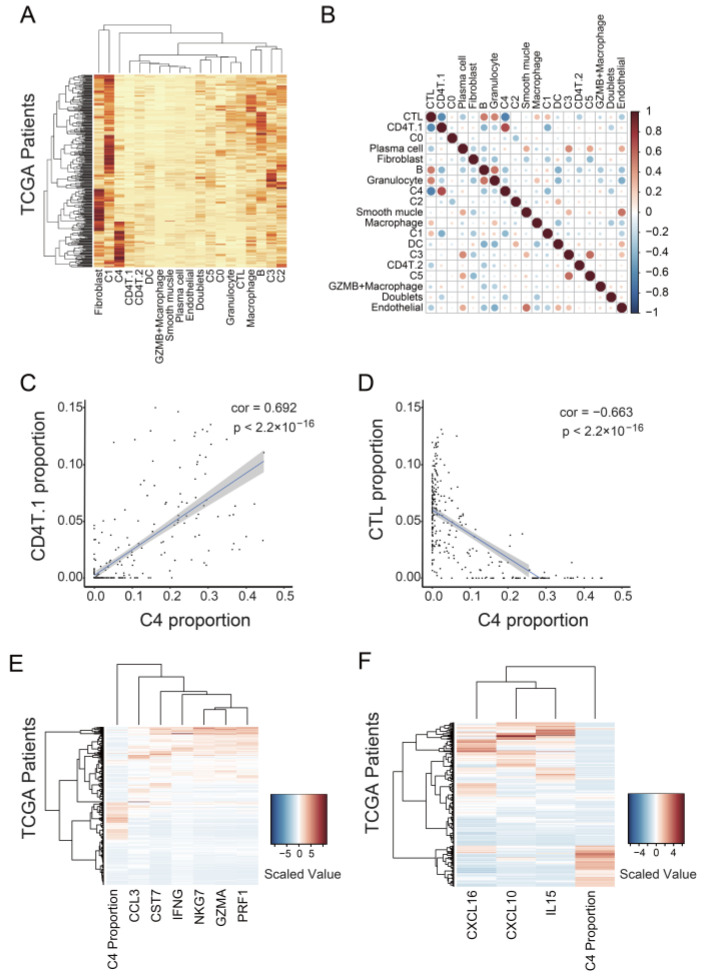
Association of the C4 cluster with CTL suppression in tumors. (A) Heatmap of Seurat cluster proportions in 307 samples from TCGA. The proportions of cells were calculated using CIBERSORTx. (B) Correlation plot of the proportions of the Seurat clusters. A strong negative correlation existed between the proportions of the C4 cluster and CTLs. (C) Scatter plot showing the proportion of the C4 cluster versus that of CD4T.1 for 307 TCGA samples. (D) Scatter plot showing the proportion of the C4 cluster versus that of CTL for 307 TCGA samples. (E) Heatmap showing the expression level of T-cell cytotoxicity-representing genes for 307 TCGA samples. (F) Heatmap showing gene expression level of chemokines and a cytokine associated with CTL migration and survival for 307 TCGA samples.

