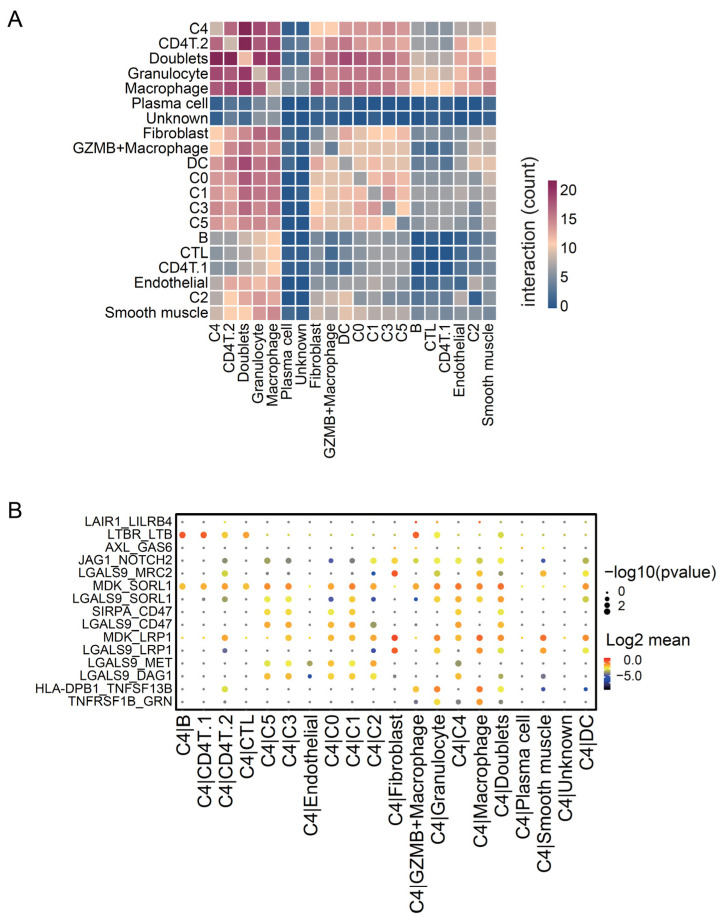
Figure 7.
Cell–cell interaction levels between the Seurat clusters. (A) Heatmap of molecular interaction levels between Seurat clusters, calculated using CellPhoneDB. (B) Dot plot of significant ligand–receptor couples between the C4 cluster and other clusters. Dot color represents the −log10 (p-value), and dot size represents the log2 (mean interaction level).

