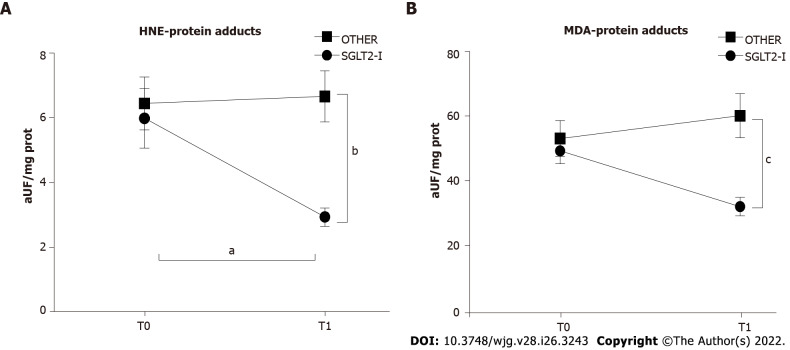
Figure 4.
Circulating markers of oxidative stress in patients enrolled in the study and included in groups treated with the sodium-glucose co-transporter-2 inhibitors or other glucose-lowering drugs before (T0) and after 1 wk of treatment (T1). Data in the graphs are represented as mean ± SEM. Two-way analysis of variance and Tukey assessed statistical differences as a post hoc test. aP < 0.05, bP < 0.01, cP < 0.001. HNE: Hydroxynonenal; MDA: Malondialdehyde; SGLT2-I: Sodium-glucose co-transporter-2 inhibitor; OTHER: Other glucose lowering drug.

