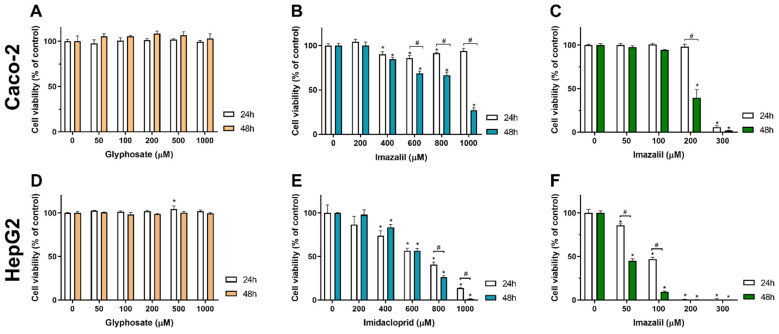
Figure 2.
Effect of glyphosate (A,D), imidacloprid (B,E), and imazalil (C,F) on Caco-2 and HepG2 cells viability. Cells were exposed to different concentrations of the mentioned pesticides, for 24 h or 48 h, then cell viability was assessed by Alamar Blue (see methods for details). Data are presented as mean ± SD (n = 4) and as percentage of control (non-exposed cells). Statistical significance (p < 0.05) between sample and respective control is denoted by an *, and # (over a square bracket) denotes statistical significance for the same concentration at different time points.

