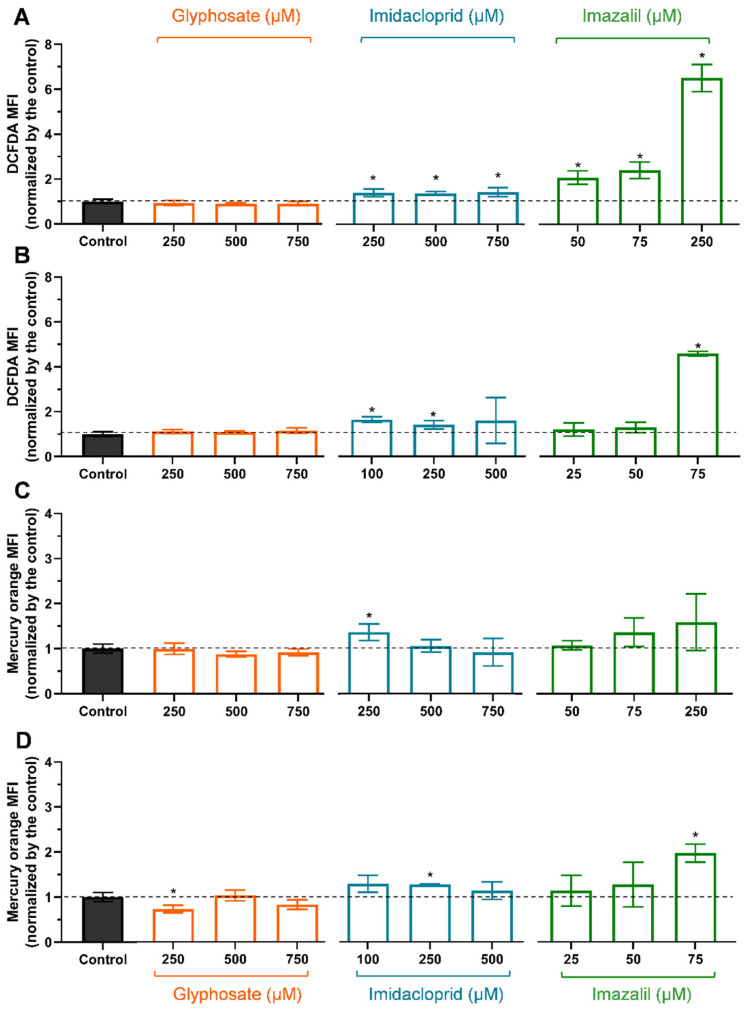
Figure 3.
Changes in intracellular reactive oxygen species ((A): Caco-2; (B): HepG2) and glutathione ((C): Caco-2; (D): HepG2) contents, induced by cells exposure to GLY, IMD, and IMZ, for 24 h, at the indicated concentrations. Results are presented as mean ± SD. Values were normalized to control cells (non-exposed cells). Significant statistical differences between the control and samples are denoted as “*” when p < 0.05.

