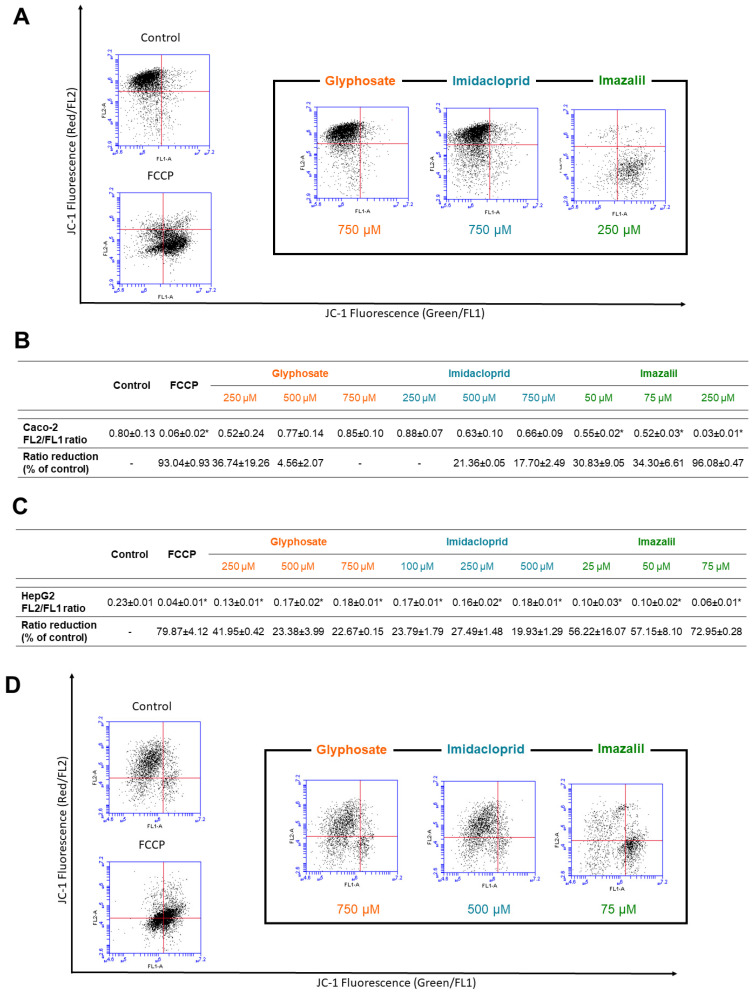
Figure 5.
Assessment of changes on mitochondrial membrane potential (MMP) in Caco-2 (A,B) and HepG2 (C,D) cells exposed to GLY, IMD, and IMZ for 24 h, at indicated concentrations. Flow cytometry dot plots of Caco-2 (A) and HepG2 (D) cells exposed to the highest concentrations of each pesticide. The calculated FL2/FL1 ratio for Caco-2 (B) and HepG2 (C) cells exposed to 3 different concentrations of each pesticide, and the percentage of FL2/FL1 rate decay comparing to respective control. Results are presented as mean ± SD. Significant statistical differences between the control and samples are denoted as “*” when p < 0.05.

