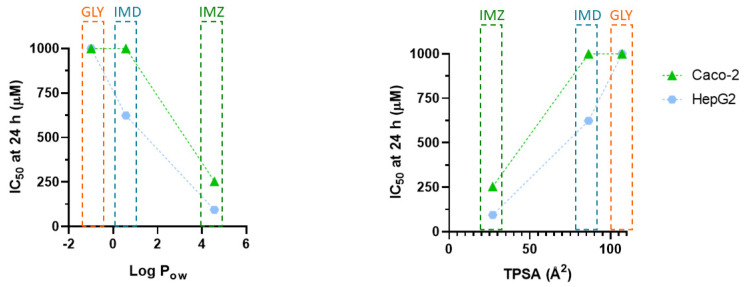
Figure 7.
Correlation between pesticides-induced toxicity, represented by IC50 values, and pesticide Log Pow (left panel) or with pesticide TPSA (right panel). The IC50 values were obtained from in vitro cytotoxicity assays (see Table 1) in cells subjected for 24 h to different concentrations of respective pesticide (see methods for details). Caco-2 and HepG2 IC50 values are denoted by green triangles and blue circles, respectively.

