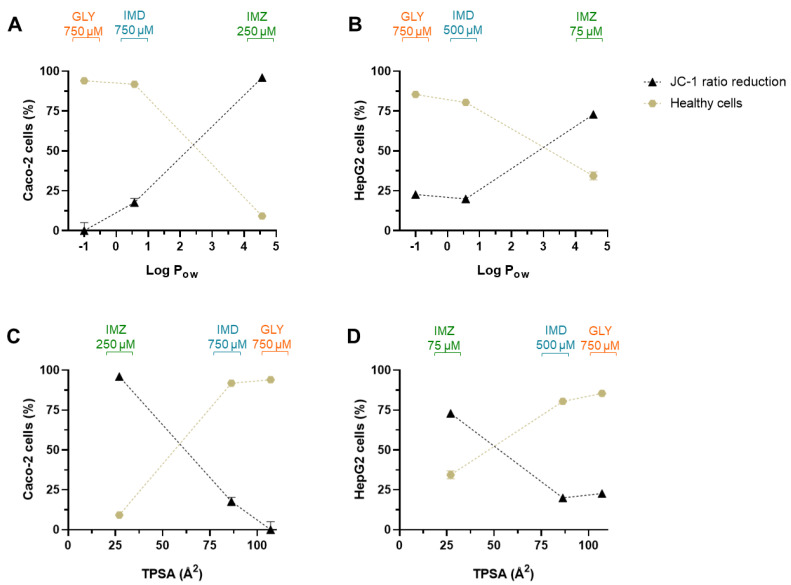
Figure 8.
Correlation between loss of MMP (assessed as % in FL2/FL1 ratio reduction, in relation to negative control cells; obtained from Figure 5) and pesticides Log Pow (A,B) or with pesticides TPSA (C,D), for Caco-2 and HepG2 cells, as denoted. Moreover, correlations between the % of healthy cells (assessed in Annexin-V/PI assay, Figure 6) and pesticides Log Pow (A,B) and with pesticides TPSA (C,D), for Caco-2 and HepG2 cells as denoted. Loss of MMP and % of healthy cells are denoted by black triangles and brown circles, respectively.

