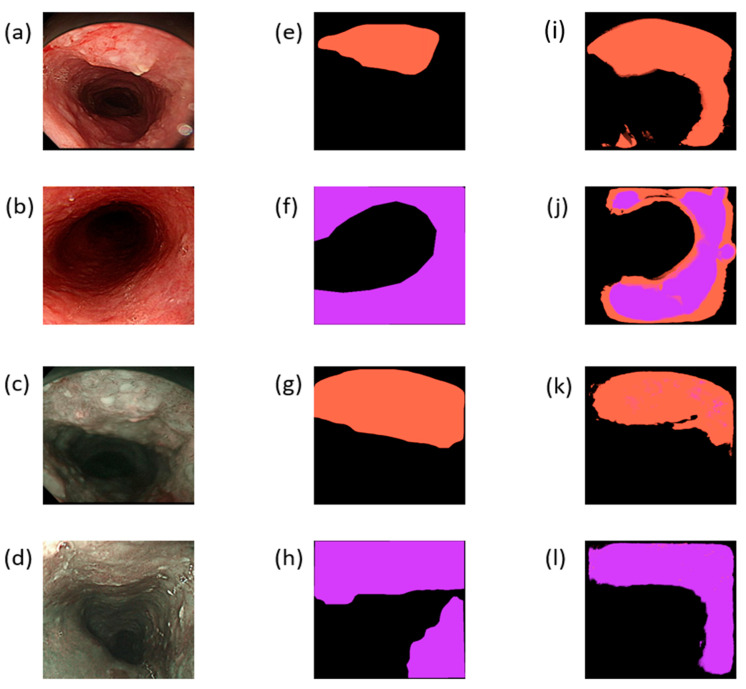
Figure 2.
(a,b) Input images after cropping the original WLI images; (c,d) input images after cropping the original NBI images. (e–h) Ground-truth maps marked by doctors based on the corresponding input images. (i–l) Prediction results of the corresponding graphs; the orange mark corresponds to SCC, whereas the purple mark corresponds to dysplasia.

