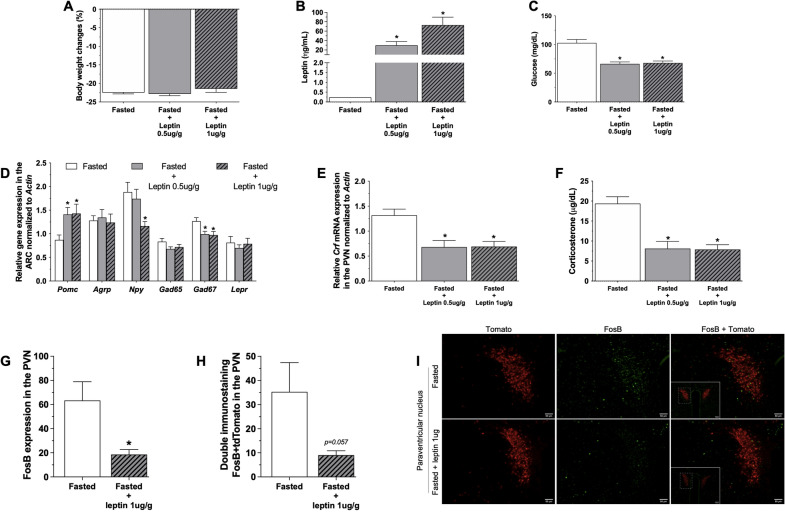
Fig. 2.
Leptin treatment prevents HPA axis activation under fasting: Body weight change (A), plasma leptin (B) and glucose (C) levels, ARC gene expression (D), Crf gene expression in the PVN (E), plasma corticosterone levels (F), FosB (G) and double FosB/tdTomato (H) immunostaining in the PVN in 36 h-fasted adult (8–10 weeks) male mice (n = 10–12) treated with 4 injections (each 8 h) of saline, 0.5 µg/g or 1 µg/g of leptin (i.p.) and euthanized at 10 a.m. as also described in the Additional file 1: Fig. S1. Data from graphs A to F were obtained in WT animals, while graphs G and H and the photomicrographs (×20, insert ×10) in I were obtained from Crh-IRES-Cre:tdTomato (red) mouse and submitted to immunostaining for FosB (green). Data are expressed as mean ± SEM and were analyzed by one-way ANOVA followed by post hoc Tukey’s multiple comparison or Kruskall–Wallis test followed by Dunn’s multiple comparison. *p < 0.05 when comparing leptin 0.5 µg/g or 1 µg/g vs saline treatment in fasted mice

