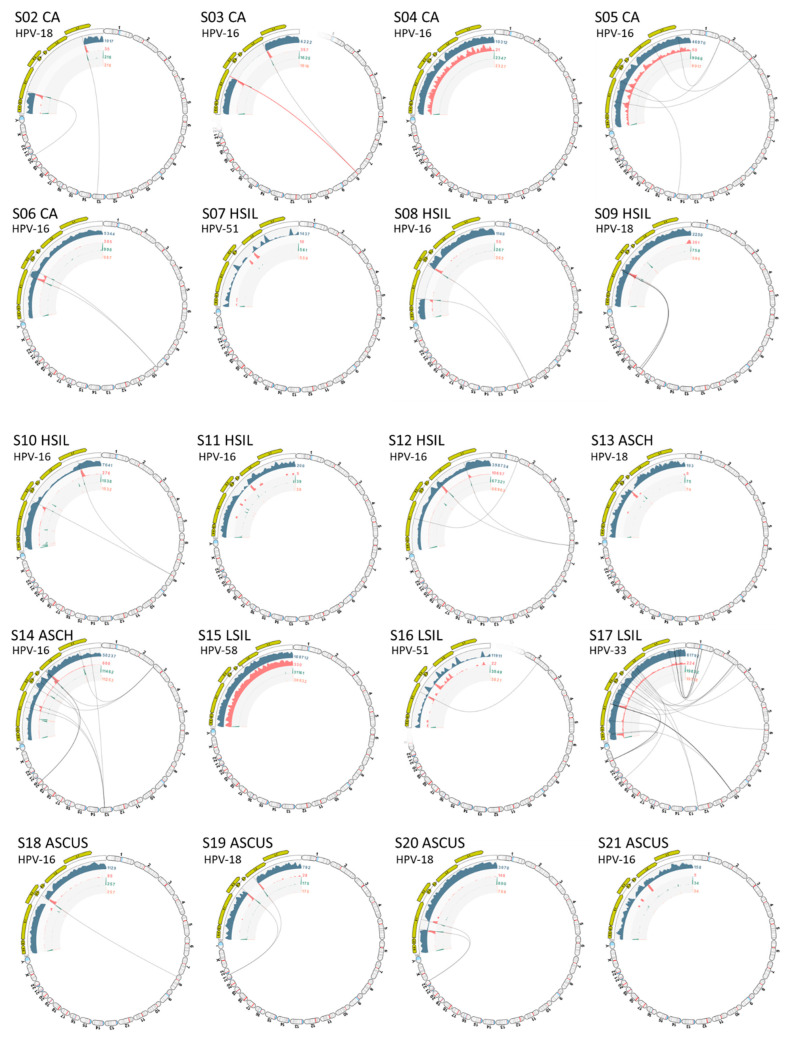
Figure 4.
Viral Integration Site (VIS) circular plots. Collage of VIS circular plots for samples (S02 to S21) in chromosome view. Virus-host integration linkages manifested as chimeric reads are designated by the bi-directional curvilinear lines. For S16, HPV-90 and -51 were integrated in chromosomes 7 and 2, respectively (only the HPV-51/chr. 2 plot is shown). The dynamic functions (rotate and zoom) of the VIS circular plot are presented in Supplementary Video S1.

