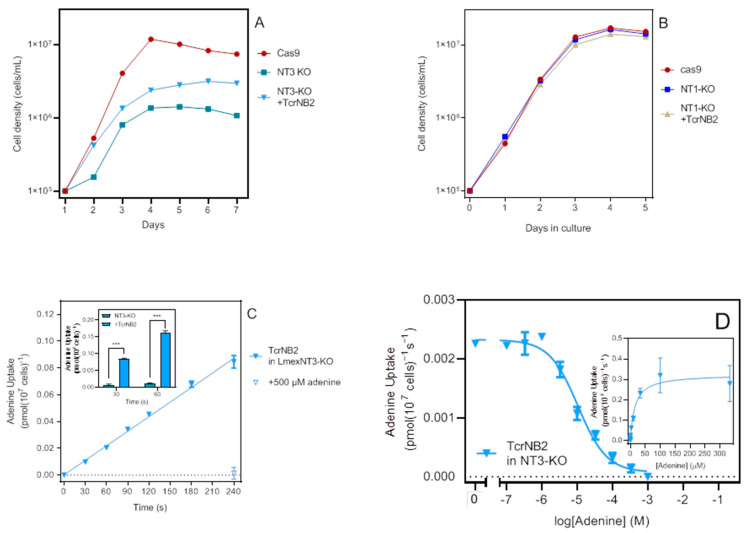
Figure 6.
Characterization of TcrNB2 in LmexNT3-KO cells. (A) Growth curve of cas9, NT3-KO and NT3-KO expressing TcrNB2. Symbols are the average of triplicate determinations. (B) Growth curve of cas9, NT1-KO and NT1-KO expressing TcrNB2. (C) Uptake of 100 nM [3H]-adenine in NT3-KO expressing TcrNB2 was linear (r2 = 0.996; not significantly non-linear, p = 0.20) and displayed a rate of 0.00036 ± 0.00001 pmol(107 cells)−1s−1. Inset: separate experiment (n = 3) of [3H]-adenine uptake by NT3-KO and NT3-KO+TcrNB2 cells. *** p < 0.0001 by unpaired t-test. (D) Uptake of 100 nM [3H]-adenine in the presence of various concentrations of unlabelled adenine. Inset: conversion to a Michaelis–Menten saturation plot. The experiment shown is one of three independent repeats, yielding a Km of 14.99 µM; incubation time was 120 s.

