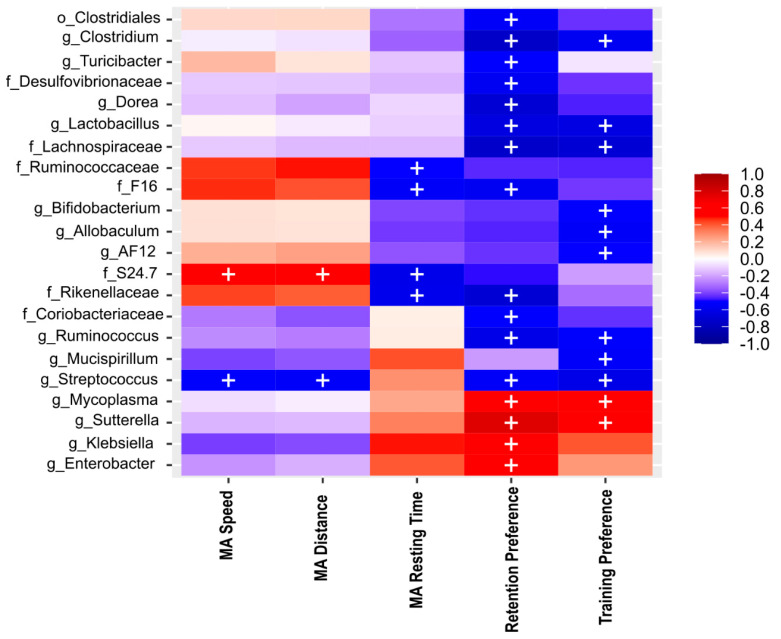
Figure 6.
Heat map of Spearman correlation between the relative abundance of the main phyla and 22 genera (see rows) identified in BGM and behavioral performance in motor activity (MA), such as speed (MA speed), traveled distance (MA distance), and resting time (MA resting time), also the preference percentage of familiar object localization in training and novel object localization in retention test of NOL (see columns) in Alzheimer’s disease triple-transgenic (3xTg) mice that received water (Ctrl) or an antibiotics (Abx). The heat colors indicate positive correlations, and cool colors indicate a negative correlation. + symbol represents significant differences (p < 0.05) observed in the correlation analysis.

