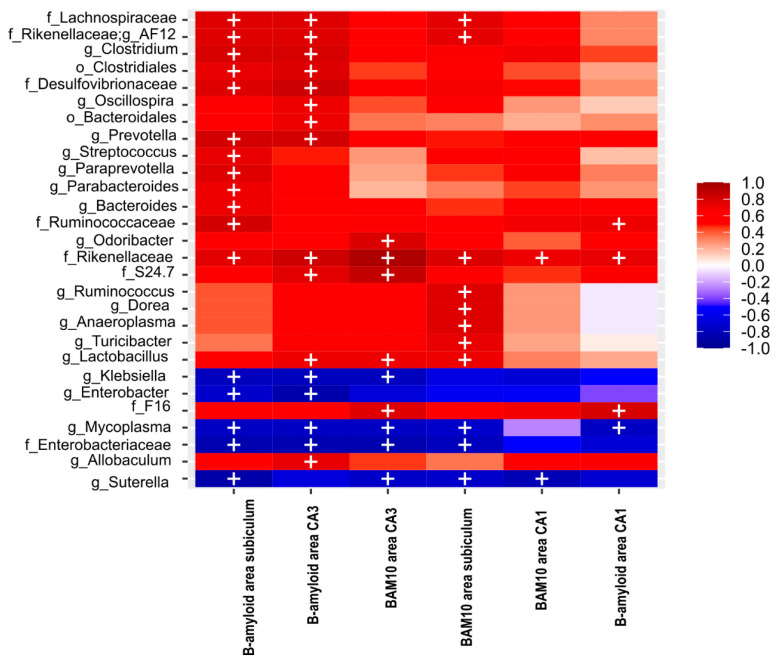
Figure 7.
Heat map of Spearman correlation between the relative abundance of the seven main phyla and 22 genera (see rows) identified in BGM microbiota and the total Aβ (BAM10) area ratio in the subiculum, CA1, and CA3 of the HIP, as well as the Aβ (B-amyloid) 1-42 area ratio in the subiculum, CA1, and CA3 of the HIP (see columns) in Alzheimer’s disease triple-transgenic mice (3xTg) that received water (Ctrl) or an antibiotics (Abx). The heat colors indicate positive correlations, and cool colors indicate a negative correlation. + symbol represents significant differences observed in the correlation analysis.

