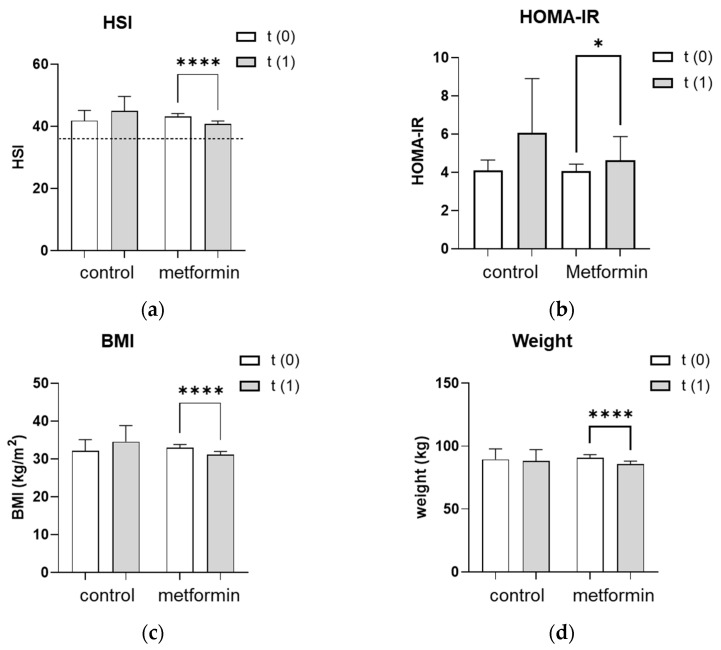
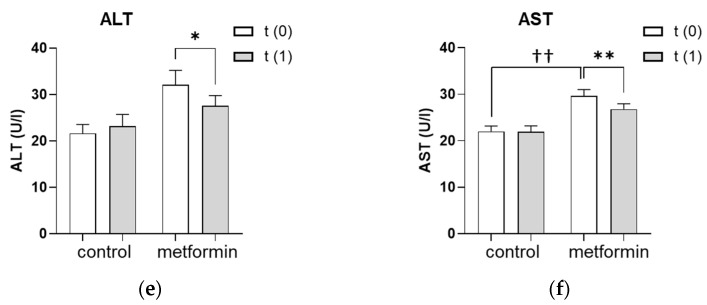
Figure 1.
Effect of seven months of metformin treatment. (a–f) Metabolic and liver parameters were analyzed at baseline (t(0)) and after an average of seven months without (control) or with (metformin) metformin treatment (t(1)). (a) The dotted line represents the cutoff of 36 for a pathologic HSI. (a–f) Differences between characteristics in the metformin group vs. the control group were tested using the Mann–Whitney U for non-parametric tests. Differences between parameters at t(1) vs. t(0) were tested using Wilcoxon tests for paired non-parametric analyses. Data are presented as mean ± standard error of the mean. * p < 0.05, ** and †† p < 0.01, **** p < 0.0001. HSI: hepatic steatosis index, HOMA-IR: homeostatic model assessment for insulin resistance, BMI: body mass index, ALT: alanine transaminase, AST: aspartate aminotransferase.


