Figure 9.

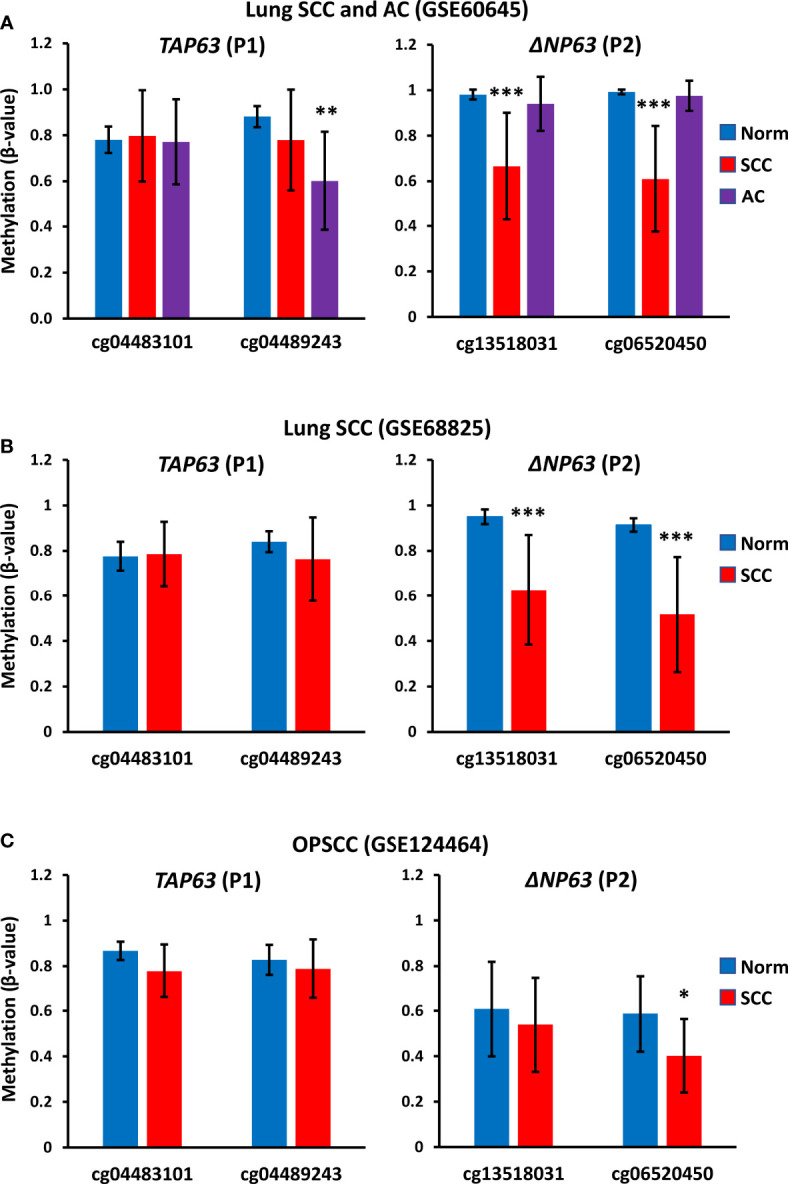
TAP63 promoter methylation levels in primary SCC tumor samples. Graphs show data for two probes (cg04483101 and cg04489243) that lie immediately upstream of the TAP63 promoter (P1) (see Figure 6) and for two probes closest to the ΔNP63 promoter (P2) identified in (25). (A) Data from GSE60645 containing normal lung (Norm; n=12), lung SCC (n=22) and lung adenocarcinoma (AC, n= 81). (B) Data from the cancer genome atlas analysis of lung SCC (GSE68825; normal lung (n=43) and lung SCC (n=96). (C) Data from GSE124464 of oropharyngeal SCC (OPSCC) (n=64) and normal oral mucosa (n=5). Graphs represent mean β-values ± SD. β-values range from 0 (no methylation) to 1 (complete methylation). *p < 0.05, ***p < 0.001, Mann-Whitney test.
