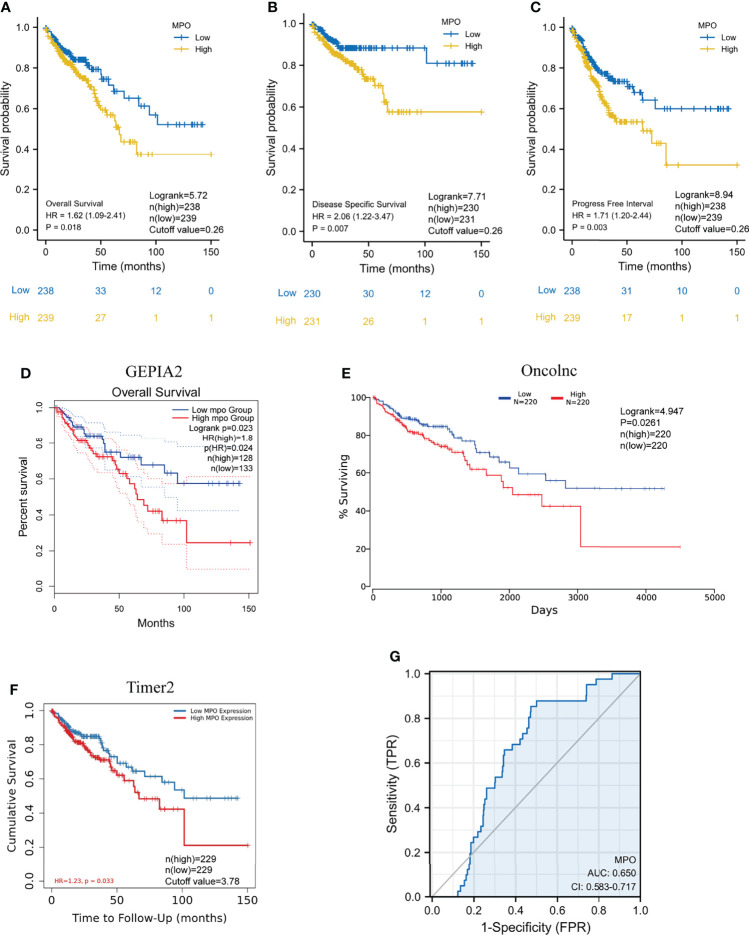
Figure 2.
High expression of MPO is related to poor prognosis in CRC patients. (A–C) Kaplan–Meier analyses of OS, PFI, and DSS between the low- and high-MPO groups in TCGA. OS: Logrank=5.72, P=0.018, n(high)=238, n(low)=239, cutoff value=0.26; DSS: Logrank=7.71, P=0.007, n(high)=230, n(low)=231, cutoff value=0.26; PFI: Logrank=8.94, P=0.003, n(high)=238, n(low)=239, cutoff value=0.26. (D–F) Gene Expression Profiling Interactive Analysis2 (GEPIA2), OncoLnc, and TIMER2 databases were used to analyze overall survival between high and low MPO groups, respectively. GEPIA2 OS: P=0.023, n(high)=128, n(low)=133; OncoLnc OS: Logrank=4.947, P=0.0261, n(high)=220, n(low)=220, cutoff value=3.78; TIMER2 OS: P=0.033, n(high)=229, n(low)=229. (G) ROC analysis with respect to the MPO expression.

