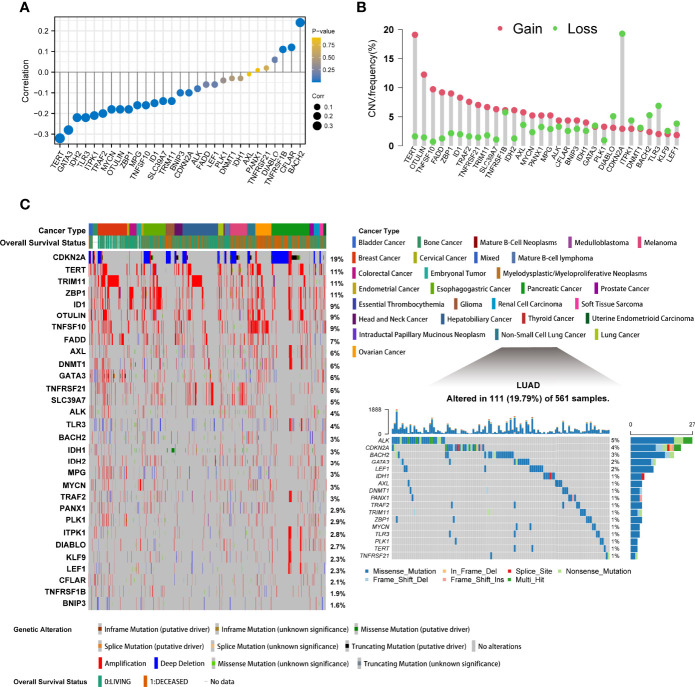
Figure 1.
The epigenetic alteration landscape of necroptosis molecules in lung adenocarcinoma. (A) The lollipop chart showed the correlations between DNA promoter methylation and mRNA expression levels. The circle size represented the correlation coefficients. Bluer dots indicated a lower p-value. (B) The CNV frequency of necroptosis regulators in TCGA cohort. The height of bars represented the alteration frequency. Pink represented CNV amplifications (gain), and green dot represented CNV deletions (loss). (C) The left part showed the mutant frequency and types in 28 cancers from cBioPortal. Each column indicated individual patients. The upper band showed cancer types and vital status. The number on the right displayed the mutation frequency of each gene. The right part illustrated the somatic genetic mutation landscape in lung adenocarcinoma in TCGA. The upper barplot showed the overall mutation frequency of each sample. The right stacked barplot demonstrated the proportion of each variant type. Only molecules having mutations, namely mutant frequency > 0%, were illustrated in the waterfall plot.

