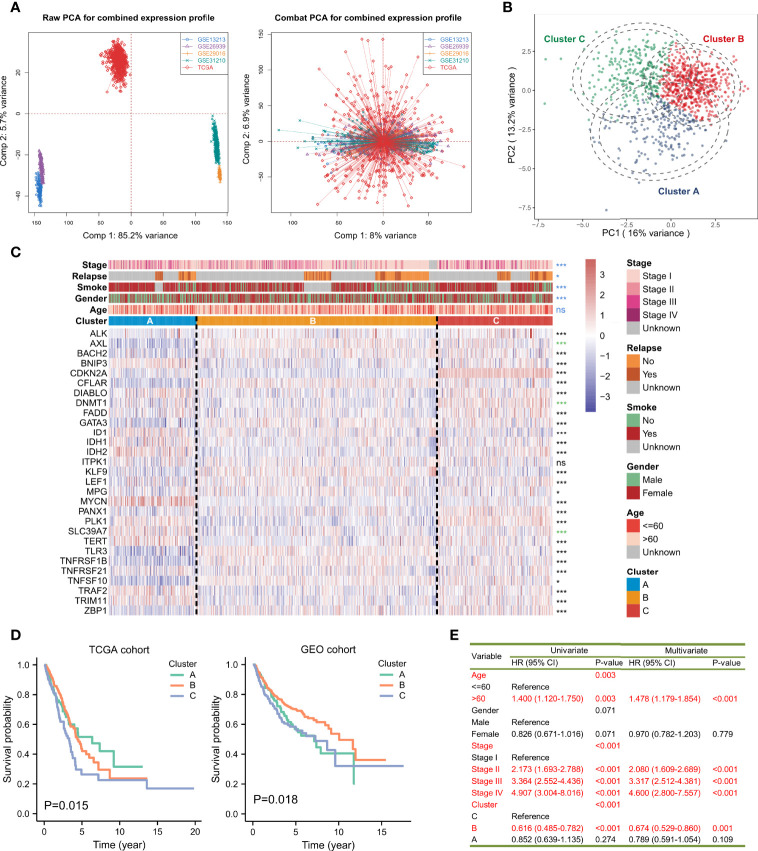
Figure 2.
Average-linked and K-means-based unsupervised clustering to determine three necroptosis phenotypes. (A) Principal component analysis (PCA) showed the distribution of transcriptional expressions of the 29 necroptosis-related genes in five lung adenocarcinoma cohorts before (left part) and after (right part) the batch effect correction. (B) PCA indicated that the expression profiles of the 29 necroptosis molecules could distinguish necroptosis phenotypes in the TCGA and GEO-meta cohorts. (C) The heatmap showed the correlations between the three necroptosis phenotypes and clinicopathologic features, and the expression changes of the 29 necroptosis-related genes. Asterisks represented p-value (***p < 0.001, *p < 0.05 and ns was the abbreviation of no significance), the color of which represented methods of statistical tests. Blue denoted Fisher’s exact test, black denoted Kruskal-Wallis test, and green denoted Welch one-way ANOVA test. The inner color of each cell demonstrated the expression variations. Redder was connected with overexpressed levels and bluer was linked with lower levels. (D) Kaplan-Meier curves and log-rank test showed significant differences of survival rate differences among the three necroptosis clustering subtypes in the TCGA and GEO-meta cohorts, respectively. (E) A univariate and multivariate Cox model revealed the prognostic influences of necroptosis subtypes on overall survival outcomes in the TCGA cohort.

