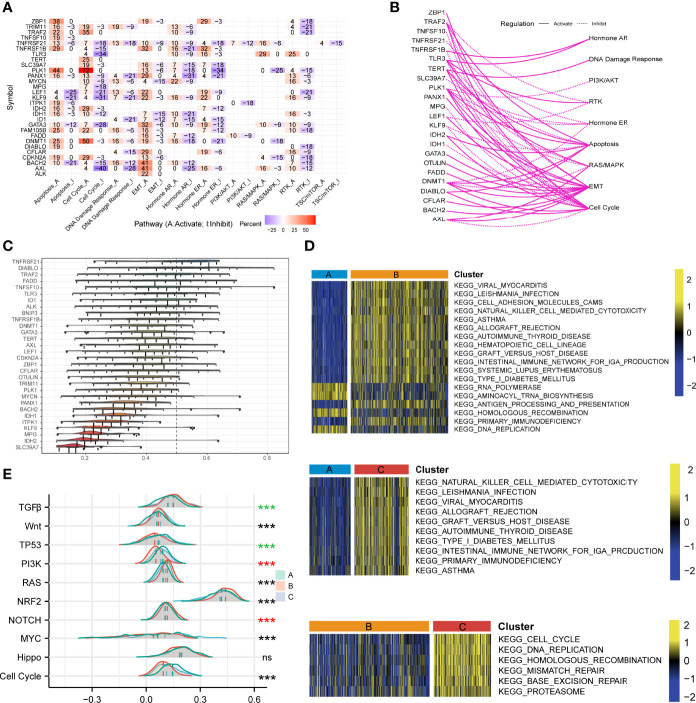
Figure 5.
Investigations of necroptosis- and cancer-related signaling pathways. (A) The heatmap illustrated the correlations between the mRNA expressions of the 29 necroptosis molecules in universally recognized cancer-related signaling pathways. Only a function (inhibited or activated) in at least 5 cancer types was displayed. “Pathway activate” in red represented the percentage of cancers where a pathway might be activated by the necroptosis regulators, and inhibition in a similar way illustrated as “Pathway inhibit” in blue. (B) The network showed the relationship between necroptosis regulatory genes by a line connection. The solid line meant activation, while dashed lines meant inhibition. (C) The distributions of functional similarities of the necroptosis-related molecules were summarized as complex boxplots. The boxes represent the middle 50% of the similarities, and the upper and bottom boundaries showed the 75th and 25th percentile. The lines in the boxes indicated the median values of the functional similarities. The continuous distribution was shown as the lines on boxes. The dots represented raw data. (D) Gene set variation analysis enrichment demonstrated the activated and inhibited states of biological pathways in distinct necroptosis regulatory phenotypes. The heatmap was employed to visualize the activity of biological pathways. Yellow represented activated pathways, and blue represented inhibited pathways. (E) The mountain graph showed the ten vital well-known cancerous signaling pathways among the three necroptosis clustering subtypes. Asterisks denoted p-value (***p < 0.001 and ns was the abbreviation of no significance), the color of which represented different statistical test methods. Black indicated Kruskal-Wallis test; red indicated one-way ANOVA test, and green indicated Welch one-way ANOVA test.

