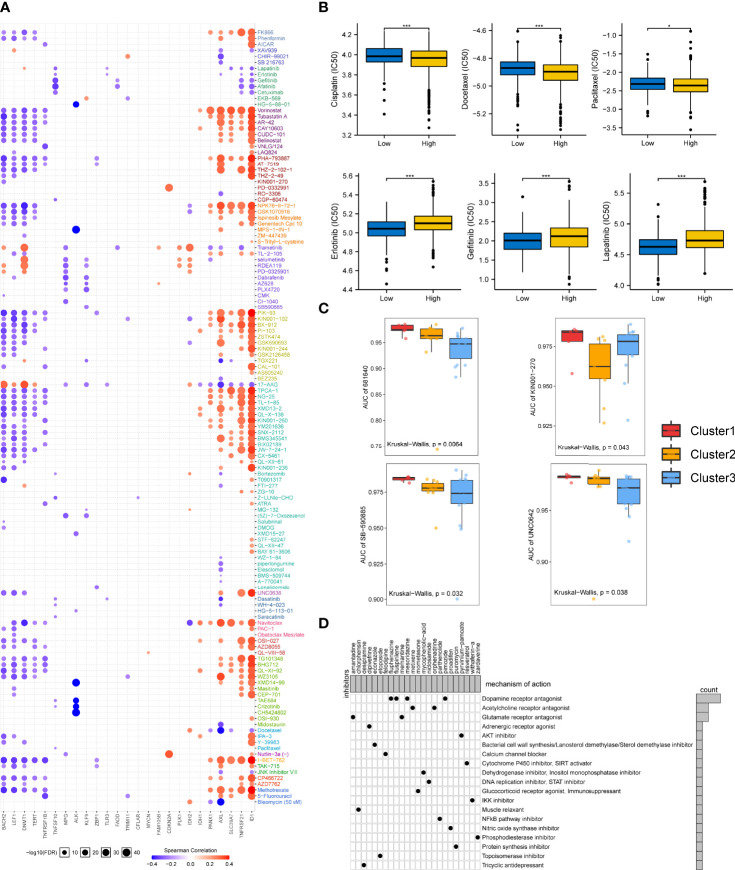
Figure 7.
Drug sensitivity in necroptosis-based subtypes and correlation between chemotherapeutic potential and the NecroScore. (A). The bubble diagram illustrated the results of correlation analysis of the necroptosis regulatory molecules on resistance to common clinical chemotherapeutics. Red indicated positive correlations, meaning that overexpressed mRNA levels of the necroptosis-related molecules were resistant to the drug and vice versa. The darker the color, the larger the correlation coefficients. The bubble size denoted the negative value of log10 of false discovery rate (FDR). (B). A Wilcoxon test showed the differences in half-maximal inhibitory concentration (IC50) between the low- and high-NecroScore groups. Asterisks indicated p-value (***p < 0.001, *p < 0.05). (C). Differences of the area under the curves (AUCs) of drug response among the three lung adenocarcinoma cell line clustering subtypes were revealed by Kruskal-Wallis test. (D). The heatmap showed each potential compounds sharing mechanisms of action (MoA, in rows) and sorted by descending number of compound with shared MoA shown in the right bar plot.

