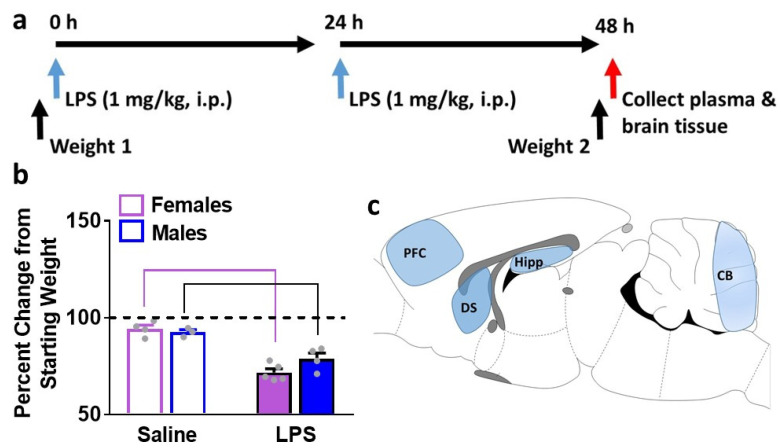
Figure 1.
Schematic of the time line of body weight measures, LPS injections, and euthanasia (a). Body weight data expressed as percent change in weight 2 from weight 1 (b). Sagittal view of the adult rat brain indicating the region of interest for dissections (c). Prefrontal cortex, PFC; dorsal striatum, DS; hippocampus, Hipp; cerebellum, CB. Data are represented as mean ± S.E.M. n = 4 control female, n = 5 LPS female, n = 3 control male, n = 4 LPS male. p < 0.05 vs. controls by post-hoc tests.

