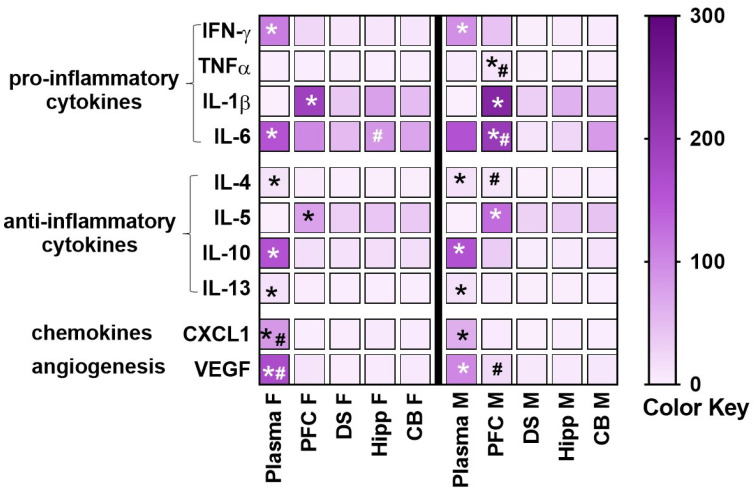
Figure 2.
A heatmap was generated to display 10 different measured inflammatory markers in healthy control (saline treated) female (F) and male (M) rats in plasma and brain tissue homogenates. Mean values without standard error are indicated in the heatmap. However, statistical analysis was performed on mean ± S.E.M. values. Prefrontal cortex, PFC; dorsal striatum, DS; hippocampus, Hipp; cerebellum, CB. White to purple transitions (color key; pg/mL) indicate, respectively, low to high average cytokine or chemokine or VEGF concentration. Data are represented as mean. n = 4 control female, n = 2–3 control male. * p < 0.05 vs. all other samples within each sex, # p < 0.05 vs. the opposite sex by post-hoc tests.

