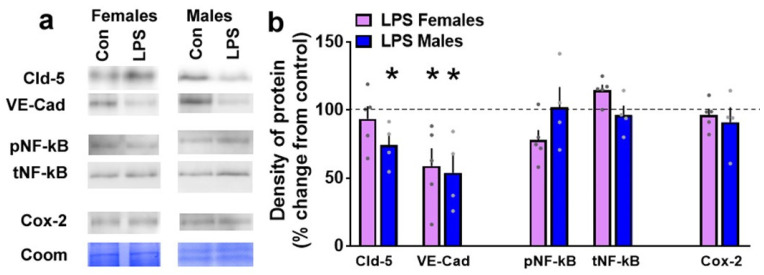
Figure 8.
Western blotting analysis of tight junction proteins and neuroinflammatory markers in the prefrontal cortex (PFC) of female and male rats that were exposed to saline or LPS challenges. Representative immunoblots with corresponding Coomassie (Coom) blot is indicated in (a). Coom band 150 kDa was used for female samples and band 250/150 kDa was used for male samples. Claudin-5, Cld-5; VE-Cadherin, VE-Cad; phospho NF-kB, pNF-kB; total NF-kB, tNF-kB; control, con. (b) Quantitative data represented as mean ± S.E.M. of percent change in density of protein from respective controls (indicated as dashed line). n = 4 control female, n = 5 LPS female, n = 3 control male, n = 4 LPS male. * p ≤ 0.05 between saline and LPS within each sex.

