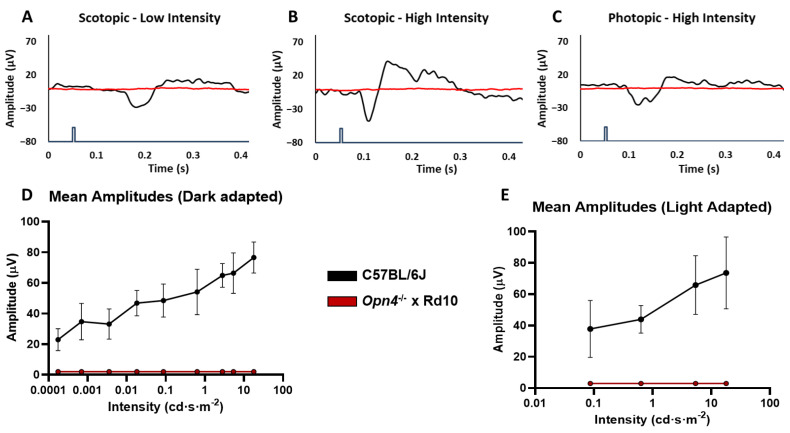
Figure 6.
Visual evoked potentials (VEP). Record of the waves corresponding to the strains C57BL/6J and Opn4−/− × Rd10 in a dark adaptation situation with low light intensity (A), dark adaptation with high light intensity (B), light adaptation with high light intensity (C). Lighting intensity curves–response amplitude in dark adaptation situation ((D)) and light adaptation situation (E). The animal model Opn4−/− × Rd10 was not capable of evoking any VEP in the visual cortex in response to light stimuli (p < 0.001). The blue line represents the light stimulus. Data is presented as the average ± SD.

