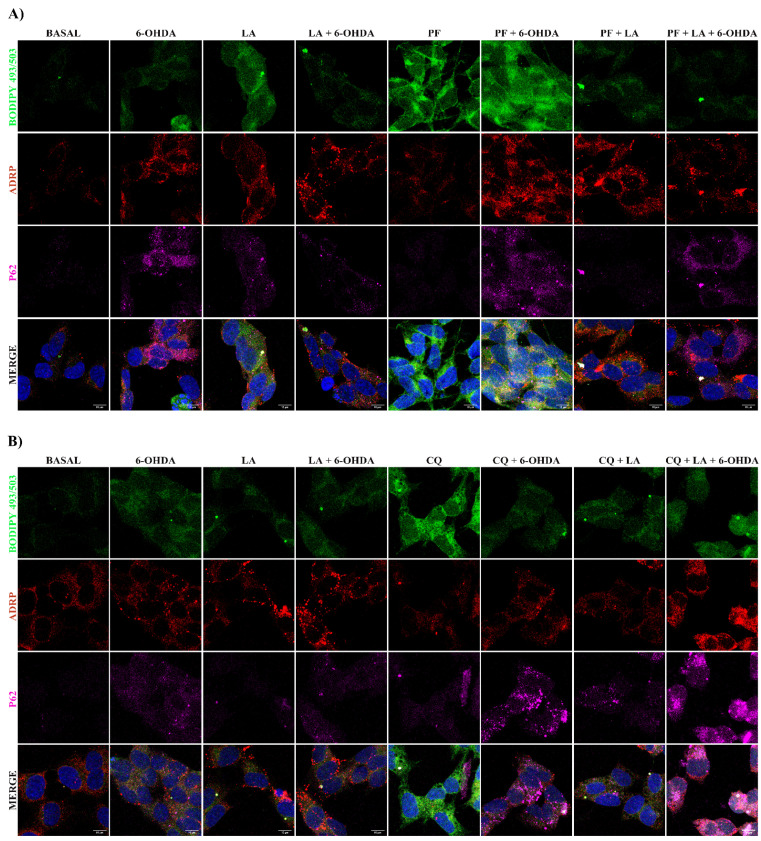
Figure A4.
Study of the LA effect on lipophagic flux and LDs dynamics on SH-SY5Y PD model. Representative maximum intensity projection of confocal images with the BODIPY 493/503 marker (green), ADRP (red), and p62 (magenta) from the SH-SY5Y cell line treated or not with LA, 6-OHDA, PF (A), and/or CQ (B) are shown.

