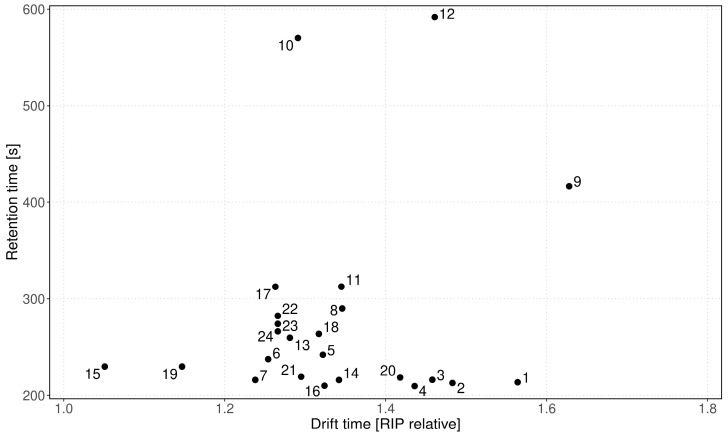
Figure 2.
Pattern (GC retention time vs. IMS drift time) of the detected 24 mVOCs in the headspace of E. coli-infected blood cultures. The peaks are numbered according to Table 1 and listed there with their particular retention-/drift times and 1/K0.

