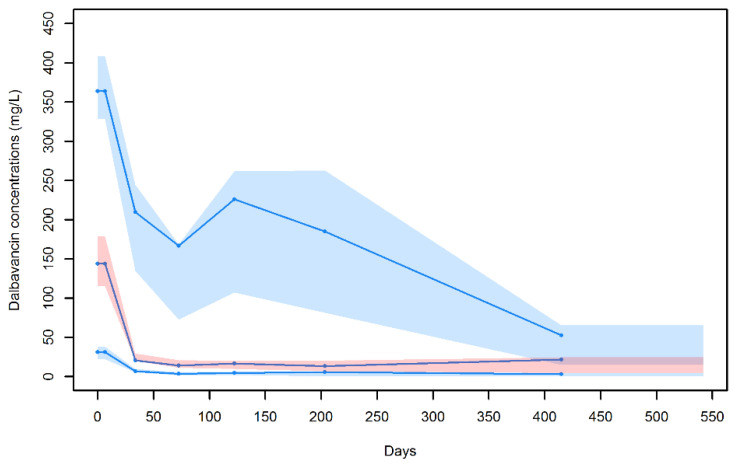
Figure 2.
Visual predictive check for the final population pharmacokinetic model. Blue dots are the observed dalbavancin concentrations; blue lines represent the median, 10th and 90th percentiles of the observed values; and shaded areas are the prediction intervals for the median (red central area) and 10th and 90th percentiles (light blue lower and upper areas).

