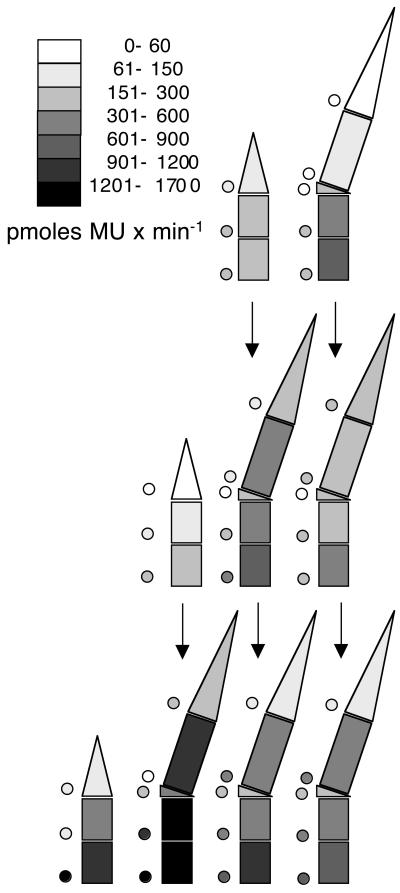
FIG. 3.
Distribution of GUS activity throughout ryegrass tillers infected with endophyte KS1, constitutively expressing the GUS gene. GUS activity was analyzed in extracts of the same sections of the same tillers whose hyphal counts are shown in Fig. 2. Tillers are represented schematically in a side view, with age of leaves increasing from left to right; the emerging leaves, which are still growing, are on the very left. Shading of the sections of the individual leaves indicates the average GUS activity in a section, according to the key provided as part of the figure (for instance, the shading of the top section of the emerging leaf in the uppermost row indicates that the tips of emerging leaves contain on average a GUS activity that falls between 61 and 150 pmol of MU per min). The shaded circles next to the sections indicate the standard deviation, according to the same key. The vertical arrows indicate the developmental fate of tissues as tillers develop more leaves (see Results for details).

