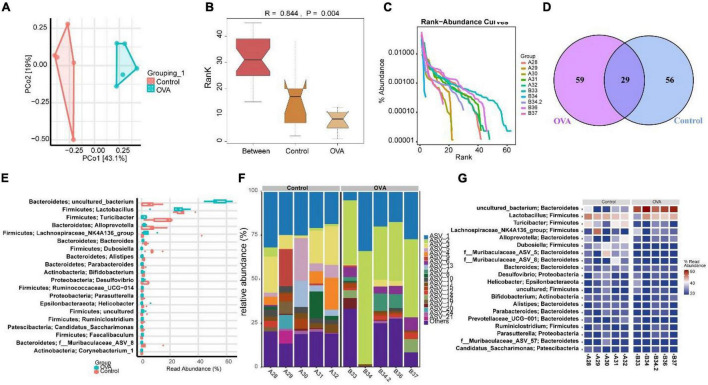
FIGURE 2.
Asthma could cause gut dysmicrobiota. (A) PCA was performed to analyze the similarity of samples. (B) ANOSIM was used to analyze the difference between two samples. (C) Rank abundance. (D) OUT Venn diagram. (E) Box diagram of phylum. (F) Phylum distribution histogram. (G) Heat map of the phylum distribution.

