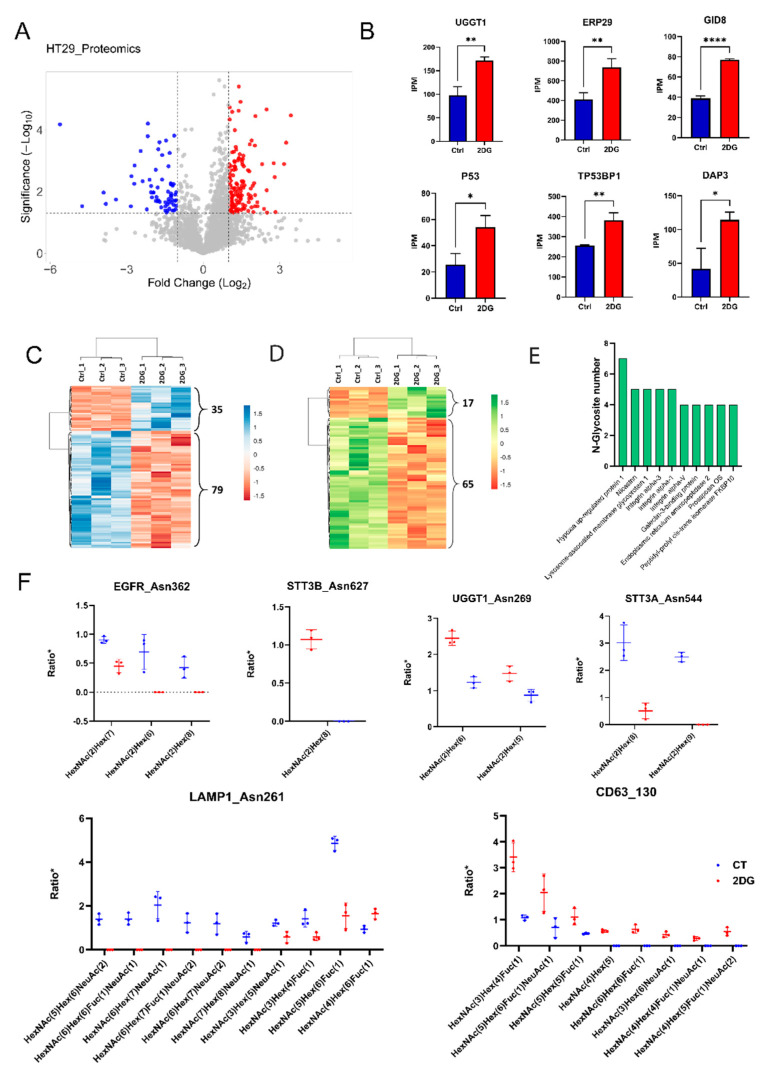
Figure 1.
Analysis of the global protein expressional changes and N-glycosylation alterations in 2DG-treated HT29 cells. (A) Volcano plot displaying the distribution of all proteins with relative protein abundance (2DG/CT fold change ≥ 2 with p-value < 0.05, red color; 2DG/CT fold change ≤ 0.5 with p-value < 0.05, blue color. *, **, and **** indicates a p-value < 0.05, 0.01, and 0.001, respectively). (B) Exemplification of six up-regulated proteins associated with 2DG treatment, including UGGT1, UGT1A10, ERP29, TP53, P53I11, and GDI8 (red color represents the relative protein abundance in 2DG-treated HT29 cell line and blue color represents the relative protein abundance in untreated control). (C) Hierarchical clustering heatmap of 114 (35 up-regulation and 79 down-regulation) altered IGPs derived from 77 proteins. (D) Hierarchical clustering heatmap of 82 (17 up-regulated and 65 down-regulated) altered intact high-mannose N-glycopeptides derived from 61 proteins. (E) Illustration of N-glycoproteins that have the most site-specific N-glycoforms. (F) Exemplification of the decrease in N-glycosylation occupancy at specific glycosites in EGFR (asn362), STT3B (asn627), UGGT1 (asn269), STTA1 (asn544), LAMP1 (asn261), and CD63 (asn130).

