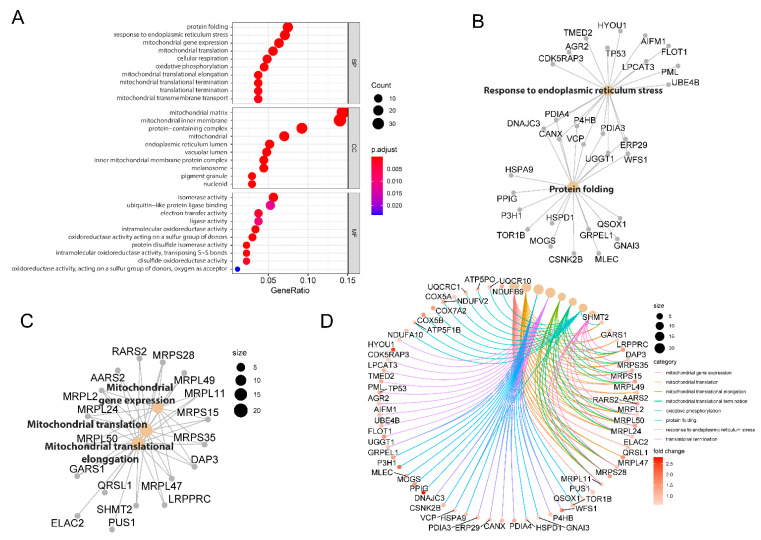
Figure 2.
Functional clustering annotation of proteome changes induced by 2DG. (A) GO analysis of up-regulated proteins associated with 2DG treatment in the HT29 cell line. Cnetplot plots show the most significant enriched terms with associated proteins. The dotplot diagram was performed in RStudio 4.0 using the ggplot2 R package. (B) The cnetplot diagram shows the relationship between the protein sets associated with the biological processes of response to endoplasmic reticulum stress and protein folding. (C) The cnetplot diagram shows the relationship among the protein sets associated with biological process of mitochondrial gene expression, mitochondrial translation, and mitochondrial translational elongation. (D) The cnetplot-circular diagram shows the 68 up-regulated proteins associated with the eight top-ranked biological processes.

