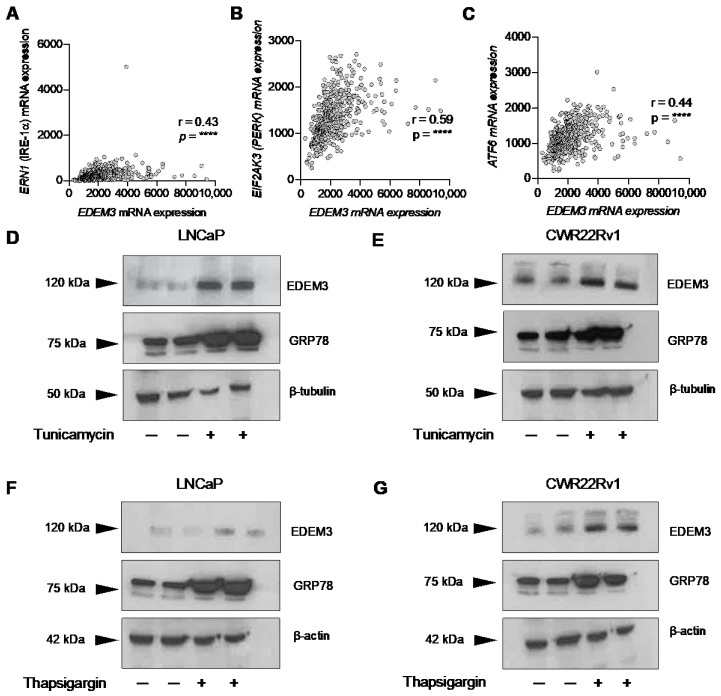
Figure 3.
EDEM3 is associated with ER stress in prostate cancer patients and is ER-stress responsive. (A–C) Spearman correlation of EDEM3 gene expression with the three UPR stress sensors ERN1 (IRE-1α), EIF2AK3 (PERK) and ATF6. Gene expression values are a part of TCGA prostate adenocarcinoma (PRAD) cohort, accessed through CBioPortal. n = 493 [28]. mRNA expression values for EDEM3 were correlated with ERN1, EIF2AK3 and ATF6. p values were calculated using a two-tailed Spearman correlation with 95% confidence intervals. **** p < 0.0001. (D) Western blot analysis of EDEM3 and GRP78 in LNCaP cells in response to 2.5 µg/mL tunicamycin for 24 h. β–tubulin was used as a loading control. (E) Western blot analysis of EDEM3 and GRP78 in CWR22Rv1 cells in response to 2.5 µg/mL tunicamycin for 24 h. β–tubulin was used as a loading control. (F) Western blot analysis of EDEM3 and GRP78 in LNCaP cells in response to 100 nM thapsigargin for 24 h. β–actin was used as a loading control. (G) Western blot analysis of EDEM3 and GRP78 in CWR22Rv1 cells in response to 100 nM thapsigargin for 24 h. β–actin was used as a loading control.

