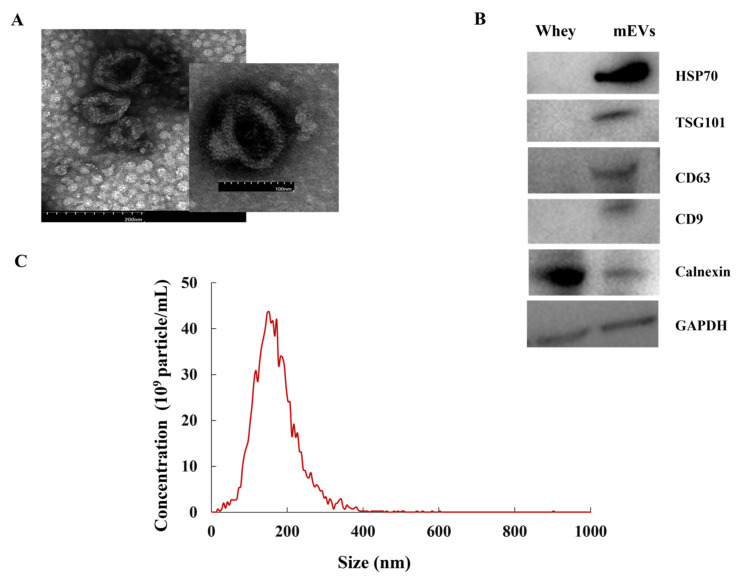
Figure 1.
The characterization of mEVs. (A) The image of mEVs by transmission electron microscopy. (B) The whey and mEVs samples characterized by Western blot for the presence of markers HSP70, TSG101, CD63, and CD9 and negative mEV-marker calnexin. (C) The size distribution and concentration analysis of mEVs by nanoparticle tracking analysis.

