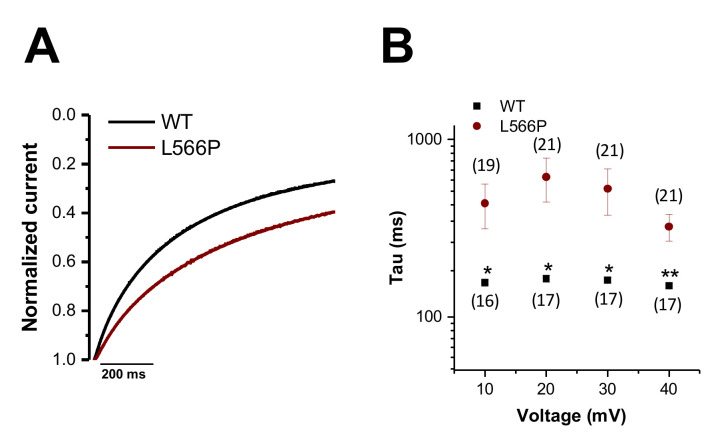
Figure 2.
Kinetics of the voltage-dependent inactivation of CaV1.2WT and CaV1.2L566P. (A) Averaged CaV1.2WT (black) and CaV1.2L566P (red) current traces at +20 mV recorded from a holding potential of −80 mV, with a voltage step of 1 s duration to +20 mV (n = 17 and n = 21, respectively). (B) Time constants of inactivation for CaV1.2WT (black) (n = 16–17) or CaV1.2L566P (red) (n = 19–21) at different potentials for the first 200 ms of inactivation derived by a mono-exponential fit. **, p < 0.01; *, p < 0.05.

