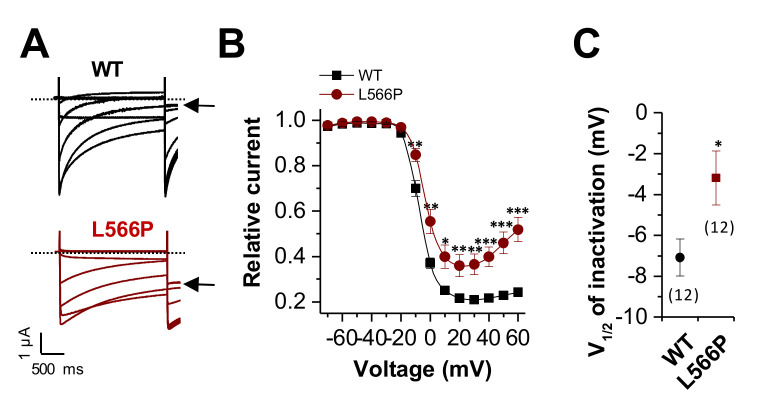
Figure 3.
Reduced and shifted voltage dependence of inactivation of CaV1.2L566P. (A) Representative current traces of CaV1.2WT (black) or CaV1.2L566P (red) recorded from a holding potential of −80 mV. Voltage was stepped to potentials ranging from −70 to +60 mV in 10 mV increments for 2 s, followed by a step to +10 mV. The sweep time interval was 30 s. (B) Steady-state inactivation curves derived by plotting the prepulse potential against the initial current recorded at the test pulse at 10 mV. (C) V1/2 of inactivation of CaV1.2WT (black) or CaV1.2L566P (red) derived by fitting the data from (B) to a Boltzmann equation. The number of experiments is indicated. ***, p < 0.001; **, p < 0.01; *, p < 0.05.

