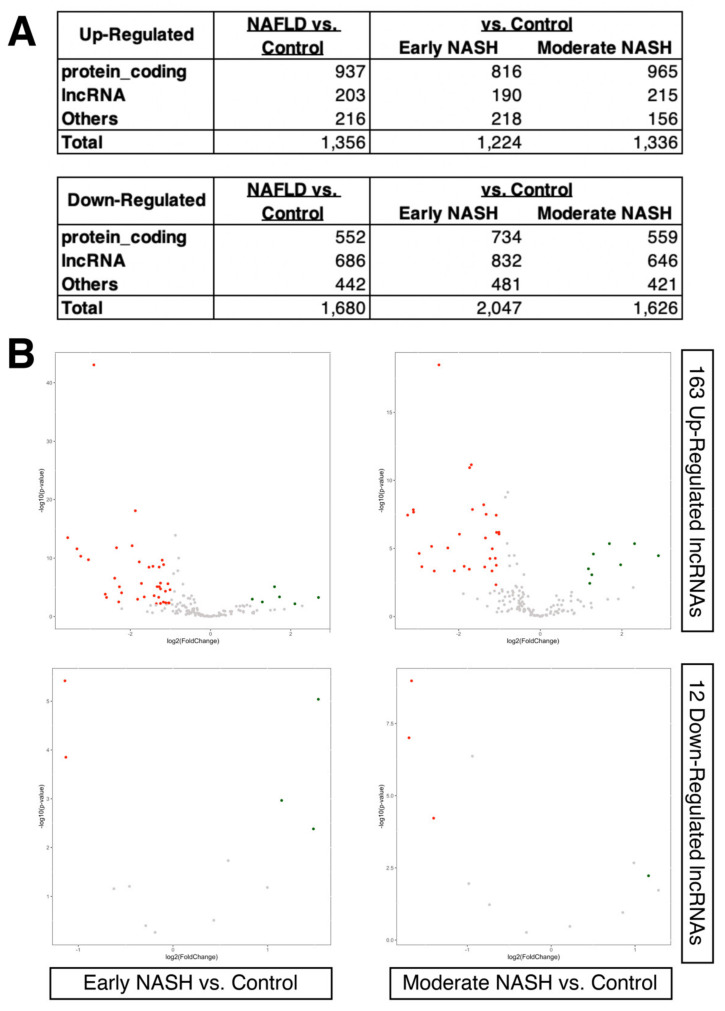
Figure 2.
Gene expression changes in different stages of NASH compared to obese individuals. (A) Tables of differentially expressed genes. The Others category includes any genes other than protein-coding or lncRNAs based on the biotypes provided by the Ensembl database. (B) Volcano plot of early (n = 138) and moderate NASH patients (n = 68) compared to the control (obese individuals; n = 10). Only 163 up- and 12 down-regulated lncRNAs identified in the previous dataset (GEO accession number, GSE126848) are shown in each volcano plot, as indicated in the figure. Up-regulated genes are colored in red, and down-regulated genes are in green.

