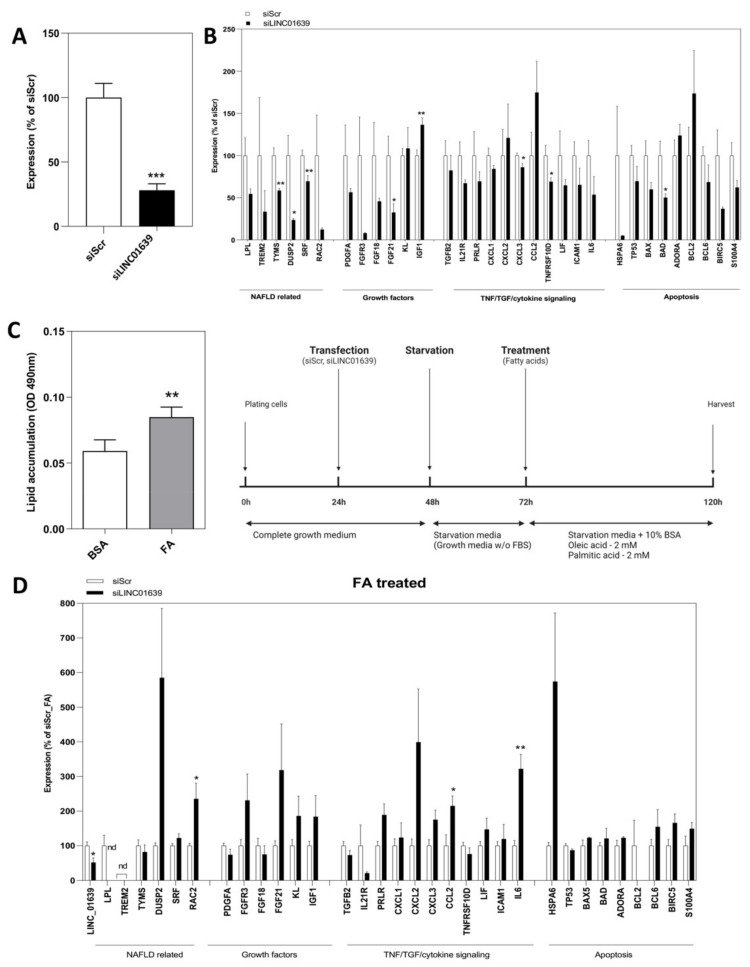
Figure 4.
Role of LINC01639 in regulation of gene expression in hepatocytes. (A) Silencing of LINC01639 in Huh-7 cells, Error bars represent mean ± S.E.M. *** p < 0.001. (B) Gene expression profile after silencing of LINC01639 in Huh-7 cells. n = three biological replicates. * p < 0.05; ** p < 0.01. (C) NAFLD cellular model. Huh-7 cells treated with a mixture of fatty acids (FA) consisting of 2 mM oleic acid and 2 mM palmitic acid at the ratio of 1:1. The schematic experimental timeline for NAFLD cellular model generation is presented. (D) Gene expression profile of NAFLD cellular model upon silencing of LINC01639 n = three biological replicates. * p < 0.05; ** p < 0.01. nd = not detected.

