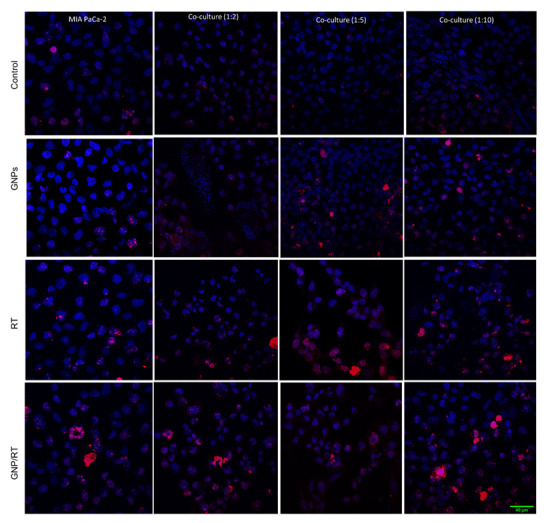
Figure 6.

Confocal microscopy images of repair protein γ-H2AX in the nucleus of MIA PaCa-2 and in CAFs. MIA PaCa-2 monoculture (1st column) vs. both MIA PaCa-2 & CAFs co-cultures, 1:2 (2nd column), 1:5 (3rd column), 1:10 (4th column) for control cells (1st row), cells incubated with GNPs (2nd row), irradiated cells (3rd row), irradiated cells with GNP (4th row). Red dots correspond to DNA DSB damages and the blue stains are the cell nuclei. Scale bar is 40 μm.
