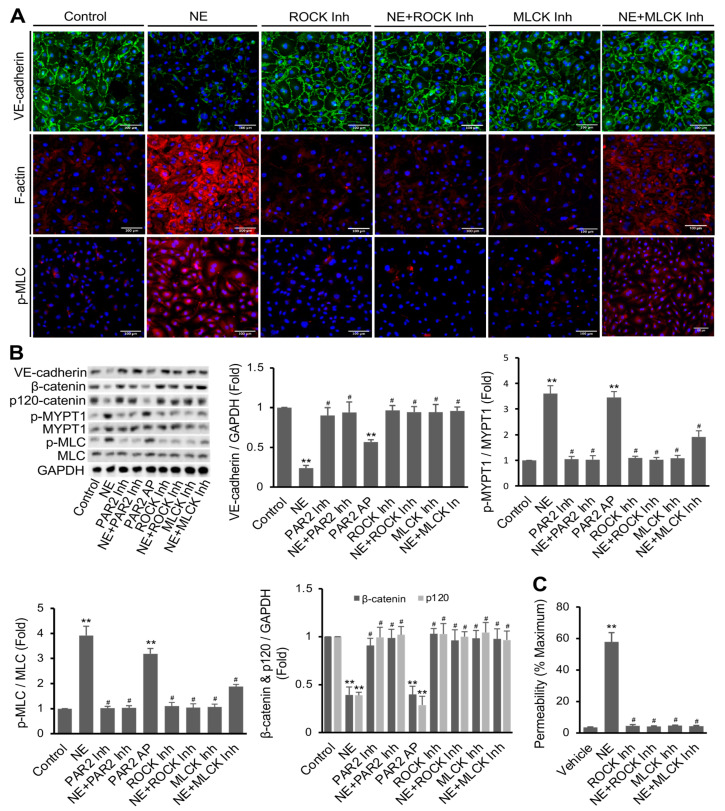
Figure 3.
Regulation of NE’s effects by PAR2 downstream signaling components ROCK and MLCK. (A) hECs were treated with ROCK inhibitor (Y27632, 5 μM) and MLCK inhibitor (peptide 18, 5 μM) with or without NE (20 nM) for 16 h. Images (20x) were taken after immunofluorescence staining of VE-cadherin (green) and p-MLC (pSer19, red), F-actin staining with phalloidin (red), and nuclei staining with DAPI (blue). Images are representatives of three independent experiments (scale bar, 100 μm). (B) Western blot analysis confirming the changes of VE-cadherin, β-catenin, p120-catenin, p-MYPT1 (pThr853), and p-MLC (pSer19) in hECs. GAPDH was used as an internal control for protein loading. (C) Confluent hECs on transwells (with 0.4 μm pore size) were treated with or without NE (20 nM) in the presence or absence of ROCK or MLCK inhibitor for 16 h. Lucifer Yellow was used to measure cell permeability, and the results were expressed as percentage of control (transwells without cells). All data are expressed as mean ± SD of three independent experiments. ** p < 0.01 vs. vehicle control group, # p < 0.05 vs. NE group. NE: neutrophil elastase, ROCK Inh: ROCK inhibitor, MLCK Inh: MLCK inhibitor. See also Figure S4.

