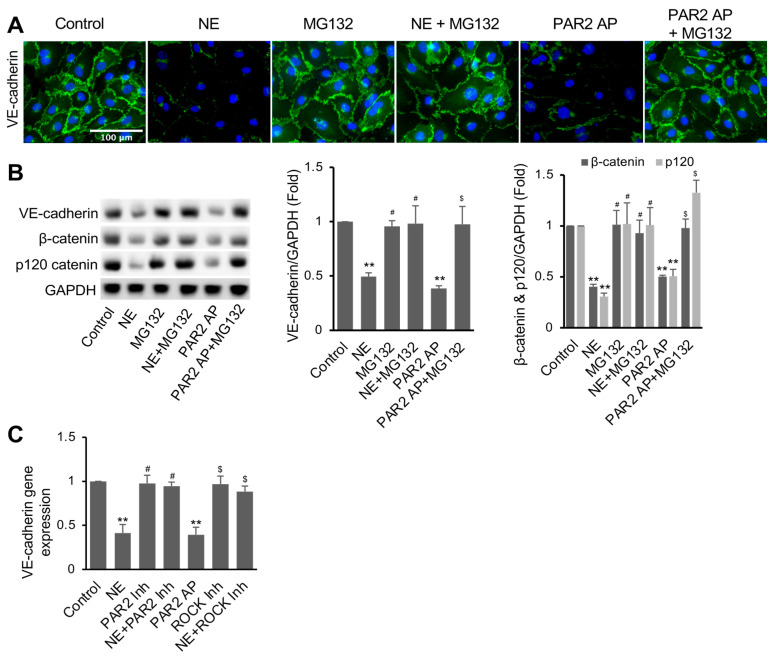
Figure 4.
Inhibition of proteasome activity reversed NE-induced VE-cadherin degradation and permeability in hECs. Cells were treated with or without proteasome inhibitor MG132 (5 μM) for 2 h before adding NE (20 nM) or PAR2 agonist (Par2-AP, 7.5 μM) for 16 h, as indicated. Then, cells were used for immunofluorescence imaging of VE-cadherin and Western blot analysis. (A) VE-cadherin fluorescence images (green) are representative of three independent experiments (scale bar, 100 μm). (B) Western blot images and quantification showing VE-cadherin, β-catenin, and p120-catenin in hECs. (C) Gene expression of VE-cadherin in hECs treated with NE (20 nM) or PAR2 agonist (Par2-AP, 7.5 μM) in the presence or absence of ROCK inhibitor (Y27632, 5 μM) for 16 h. RT-PCR was used for quantifying gene expression levels of VE-cadherin normalized to 36B4 for each sample. All data are expressed as mean ± SD of three independent experiments. ** p < 0.01 vs. vehicle control, # p < 0.05 vs. NE group, $ p < 0.05 vs. PAR2-AP. PAR2-AP: PAR2 agonist (PAR2 (I-6) amide trifluroacetate salt) (7.5 μM), ROCK Inh: ROCK inhibitor. See also Figure S4.

