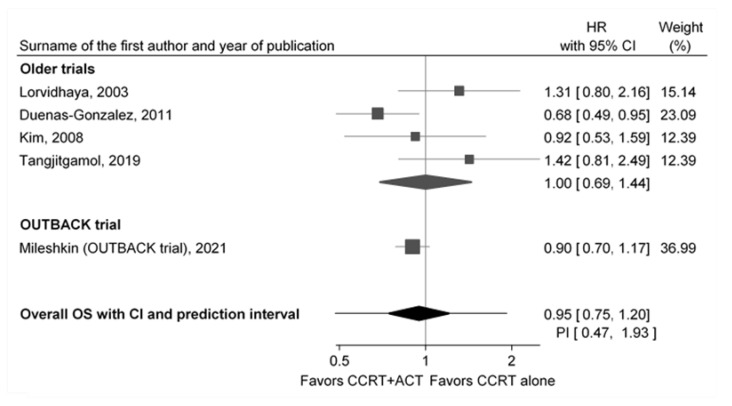
Figure 1.
Forest plot of the effects of CCRT + ACT compared to CCRT alone on overall survival; gray squares represent each study hazard ratio (HR) for dying from any cause and whiskers represent 95% confidence intervals (CI); the size of the squares represent the weight of the study inverse to the study variance; black diamonds represent the pooled hazard ratio for older trials and for all trials (older and OUTBACK trial) calculated using a random effects model with a restricted maximum-likelihood method; whiskers from the lower “overall” diamond represent 95% prediction interval (PI); studies are sorted by the year of the end of enrollment.

