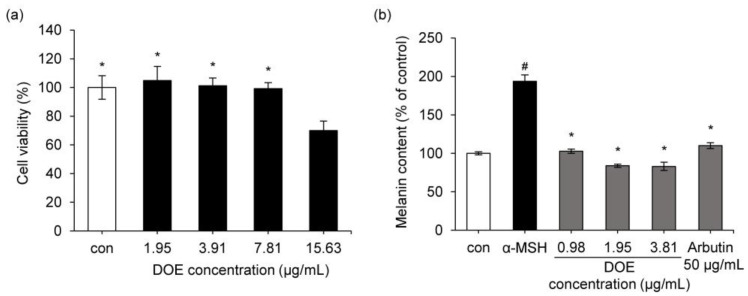
Figure 3.
(a) Effect of DOE on the viability of B16F10 cells. * p < 0.05 vs. DOE 15.63 μg/mL treated group. (b) Effect of DOE on α-MSH-induced melanin biosynthesis in B16F10 cells. * p < 0.05 vs. α-MSH-treated group. # p < 0.05 vs. control group. Positive control = 50 μg/mL arbutin. Data are presented as mean ± SD.

