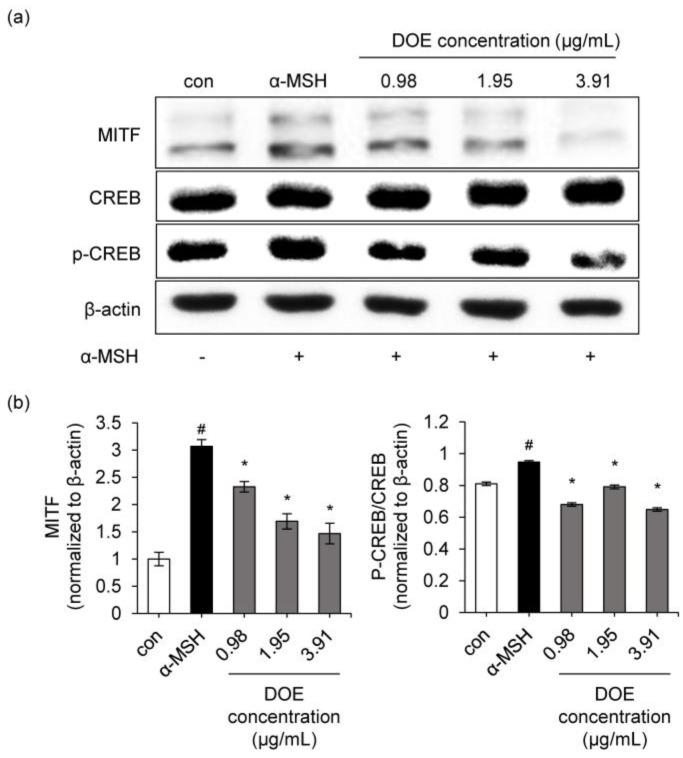
Figure 5.
(a) Effects of the DOE on the protein expressions of MITF, p-CREB, and CREB in B16F10 cells. B16F10 cells were treated with different concentrations of DOE ranging from 0.98 to 3.91 μg/mL. Protein expressions of MITF, p-CREB, and CREB were analyzed by Western blotting. Equal protein loading was confirmed using β-actin antibody. (b) Protein levels of MITF, p-CREB, and CREB proteins. The relative level of each protein was calculated based on the intensity of actin protein and CREB. # p < 0.05 vs. control. * p < 0.05 vs. α-MSH-treated group.

