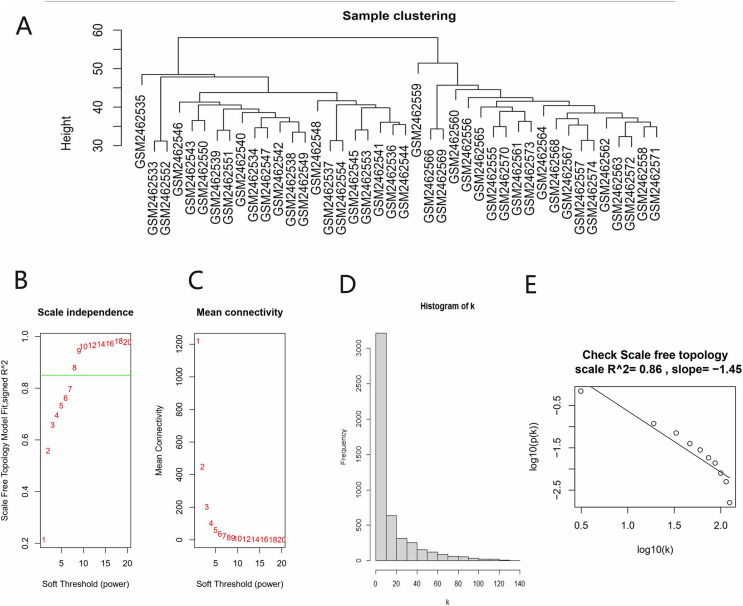
Figure 2. Data verification and filter the best soft threshold.
(A) Sample clustering to view heterogeneity. (B) Soft threshold non-scale fitting index analysis. (C) Soft threshold average connectivity analysis. (D) Histogram of the connectivity distribution when the soft threshold value was 8. (E) Check scale-free topology scale when the soft threshold value was 8.

