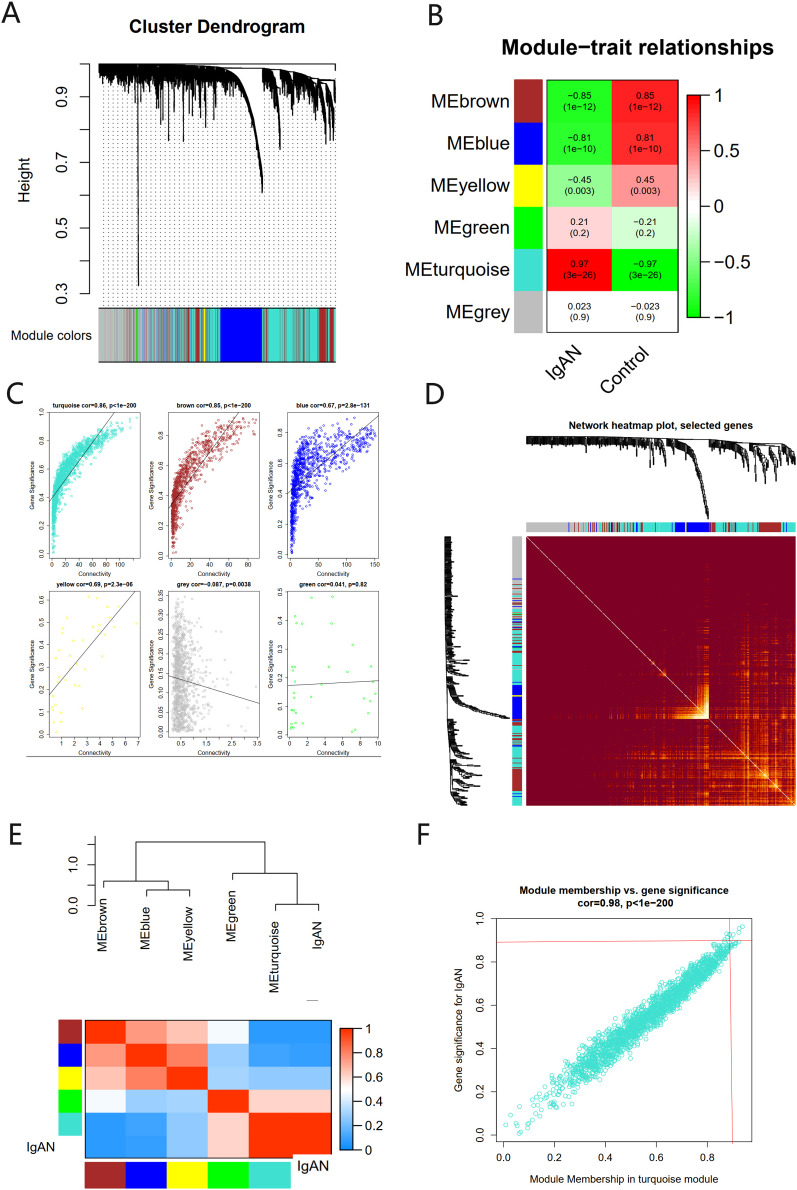
Figure 3. The co-expression network constructed based on the GSE93798 dataset.
(A) Gene dendrogram. (B) Heat map of module–trait relationships. (C) Distribution of average gene significance in the six modules. (D) Heat maps visualizing 400 randomly selected genes in the network to depict the TOM. (E) The combination of eigengene dendrogram and heatmap. (F) The distribution of GS and MM was presented as a scatter diagram in the turquoise module.

